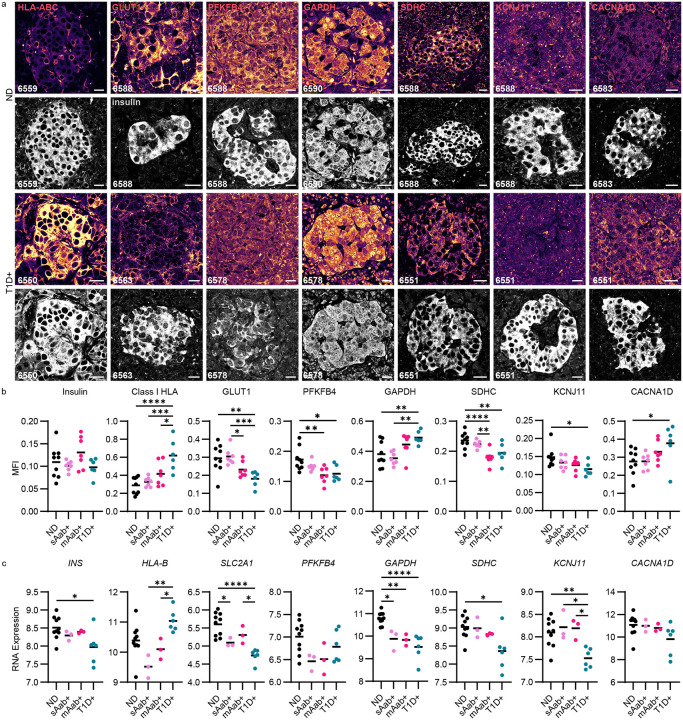
Figure 4:
Beta cell glucose metabolism is disrupted during T1D pathogenesis. a) Immunofluorescent images from ND and T1D+ donors representative of the dataset plotted in panel b. Scale bars, 20 μm. b) Protein expression levels indicated by mean fluorescence intensity during the different stages of T1D development in donors with ND (n=9), sAab+ donors (n=7), mAab+ donors (n=7), and T1D+ donors (n=6). Scale bars, 20 μm. One-way ANOVA with multiple comparisons, *P<0.05, **P<0.01, ***P<0.001, ****P<0.0001. c) RNA expression levels of glucose metabolisms markers in laser-capture micro-dissected islets from donors at different stages of T1D development (ND, n=10; sAab+, n=3; mAab+, n=3; T1D+, n=6). One-way ANOVA followed by a Tukey post-hoc test, *P<0.05, **P<0.01, ***P<0.001, ****P<0.0001.

