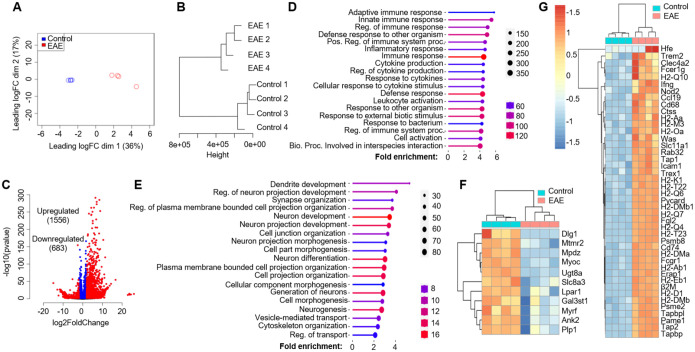
Figure 2. Oligodendroglial lineage reactivity at the onset of EAE.
Spinal cords from Oligo2-Cre RiboTag EAE mice at disease onset and naïve control mice were homogenized, and mRNA was isolated following immunoprecipitation with anti-HA antibodies targeting ribosomes. The purified mRNAs underwent RNA-Seq using an Illumina NovaSeq sequencer. The RNA-Seq data were analyzed as follows:
(A) Multi-dimensional scaling (MDS) plot displaying RNA-Seq data from spinal cords of Oligo2Cre RiboTag naïve control mice and EAE mice at disease onset.
(B) Hierarchial clustering utilizing ward D2 distance metrics, highlighting distinct clustering of the samples.
(C) Identification of differentially expressed genes (DESeq2) in EAE compared to the naïve group, using a Log2Fold change cutoff of 2.0 and padj=0.05.
(D) Presentation of the top 20 enriched pathways for 1556 upregulated genes.
(E) Top 20 enriched pathways for 683 downregulated genes, as determined by the GO biological process database from the ShinyGO web server.
The heatmap illustrates differentially expressed genes categorized into:
F) Myelination and Myelin assembly.
G) Antigen processing and presentation, within the GO biological process category. n=4/group.

