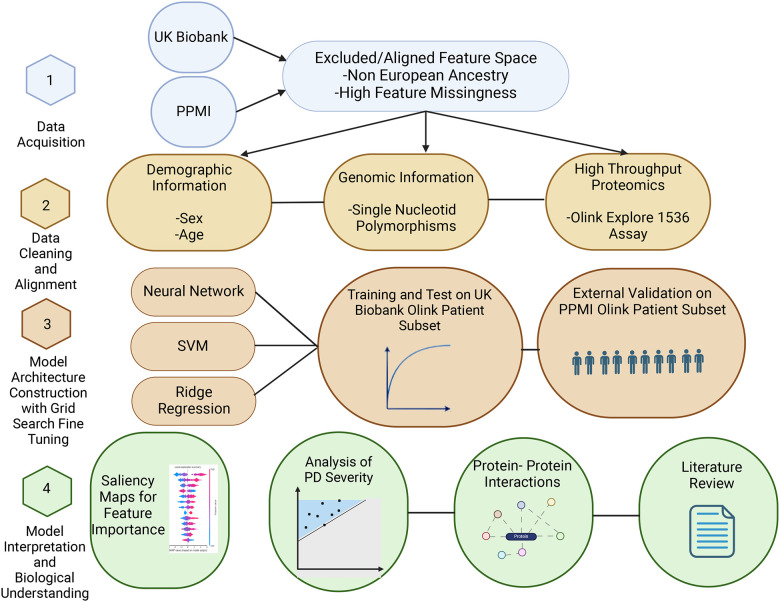
Figure 1:
Outline of the study. The study is composed of four steps. In the first step data QC and filtering was performed. In the second step serum proteomic Olink data and SNP polymorphism arrays features from the UK Biobank and PPMI were matched to a common subset. These features were used in a ridge regression, support vector machine and neural network models to predict PD cases in the third step. The last step included biological interpretation of the features and correlation with PD severity scores.

