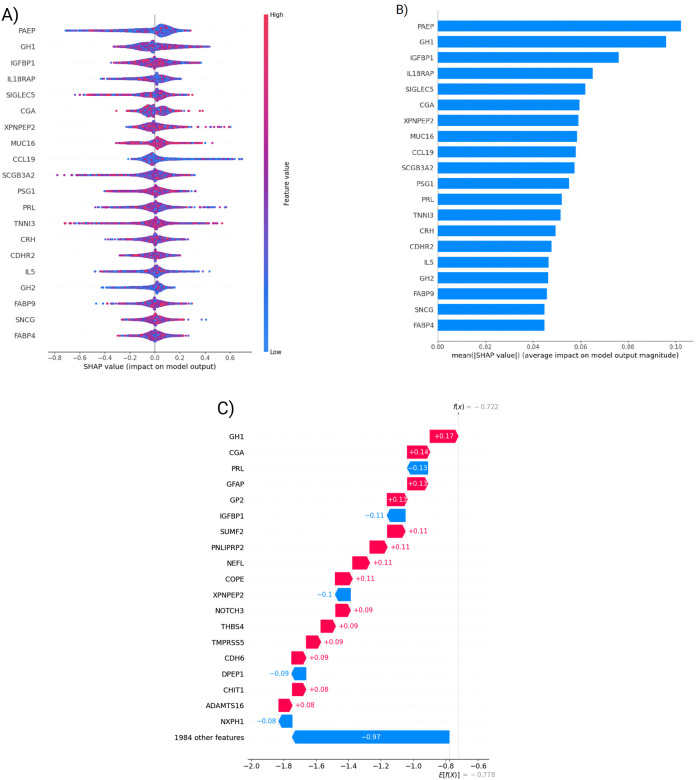
Figure 3:
Evaluation of top 20 Neural Network features A) SHAP value distributions of the top 20 neural network features. Each feature is represented by the distribution of SHAP values (i.e. impact on model output) over all test cases. Negative values represent negative weights for PD prediction whereas positive values represent positive contribution to predicting PD. B) Mean absolute SHAP values showing feature importance of the same 20 features. C) A waterfall plot showing SHAP values, contribution to classification result for a single UK biobank participant.

