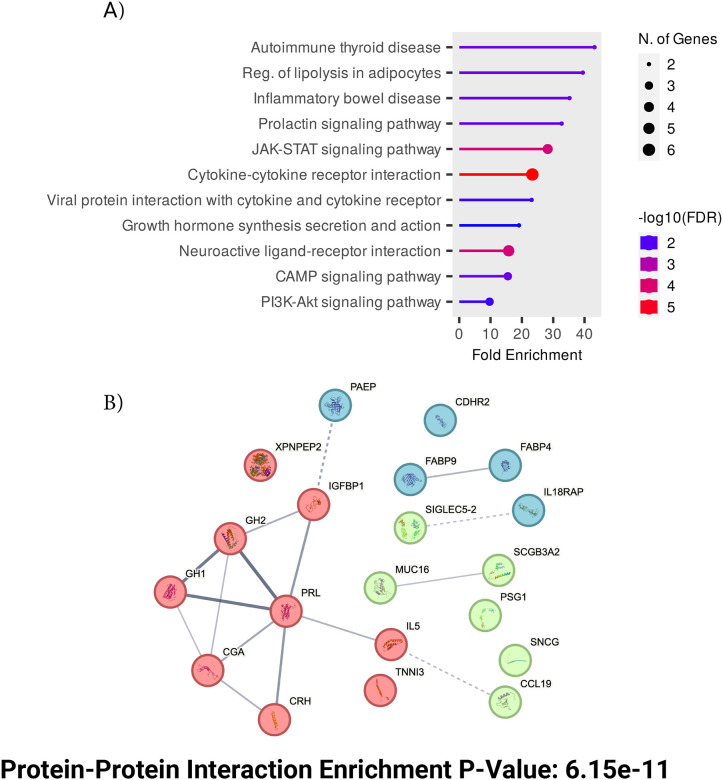
Figure 4:
Top features functional analysis (A) KEGG pathway analysis of the top features, based on the genes corresponding to the identified proteins, highlighting key biological pathways involved. (B) Protein-protein interaction (PPI) networks displaying the number of expected interactions of random proteins versus observed interactions. The PPI network exhibits significant enrichment with a p-value of 6.15e-11. Three distinct clusters are shown in different colors. With the thickness of connections denoting strength of connectivity across experimental data and literature data.

