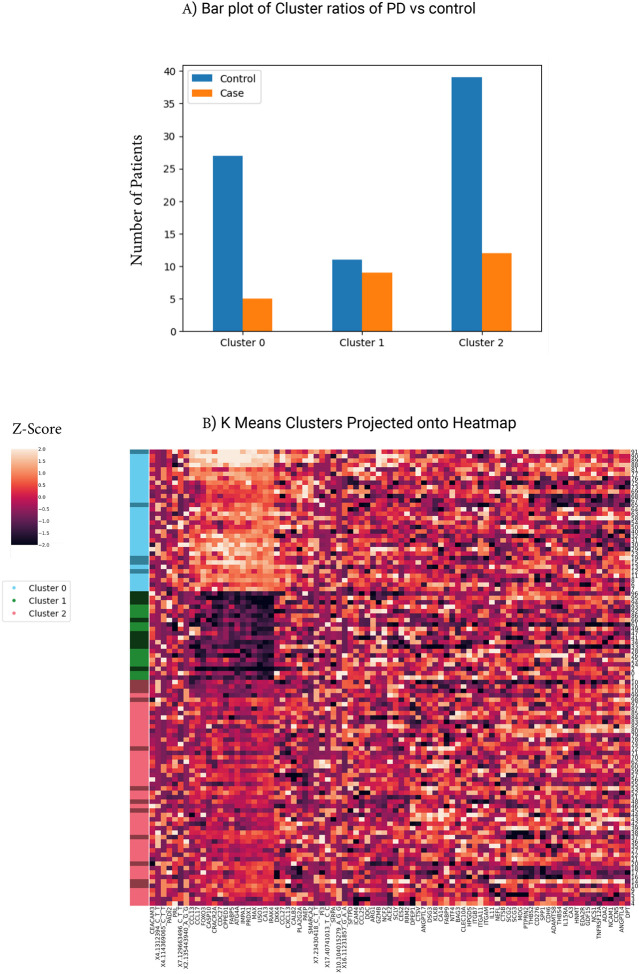
Figure 6:
Feature clusters identify protective PD proteins (A) KNN clustering of top 85 features identified three predominant clusters. Bar plot highlighting the enrichment of PD relative to controls in Cluster 1. (B) Heatmap of protein levels (Z-scores) expression in the PPMI datasets. Left side color strip indicates cluster assignment (cluster 0 is blue, cluster 1 is green and cluster 2 is red) where darker green, blue or red indicate PD cases while lighter colors indicate controls. Proteins are clustered to identify cluster signatures.

