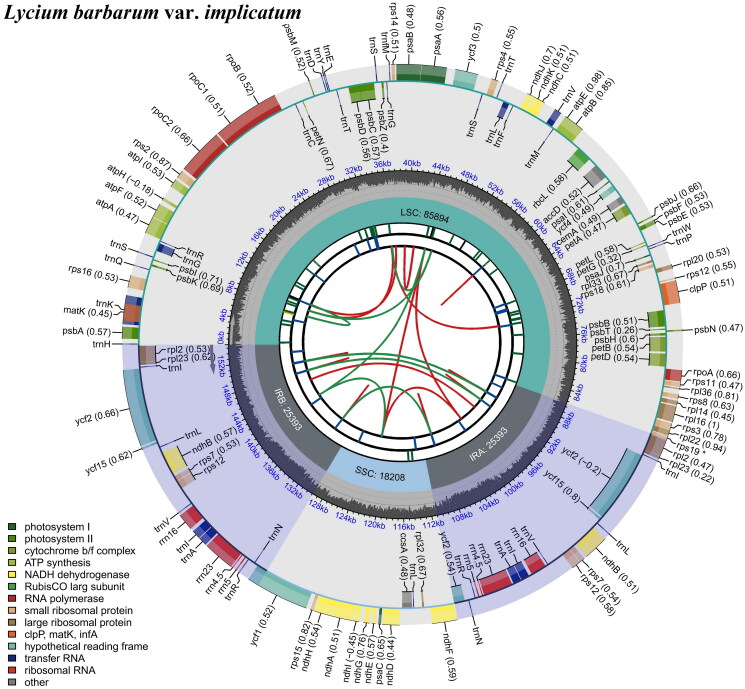
Figure 2.
Genomic map of overall features of the cp genome of L. barbarum var. implicatum was visualized using CPGview. This map consists of six tracks arranged from the center outward. The first track represents dispersed repeats, while the red arcs depict direct repeats and the green areas represent palindromic repeats. In the second track, a long tandem repeat is indicated by short blue bars. The third track displays short tandem repeats or microsatellite sequences as colored bars. The fourth track illustrates the regions of small single-copy (SSC), inverted repeat (IRs), and large single-copy (LSC). Additionally, the fifth track showcases the GC content of the cp genome, while in the last track coding genes are categorized based on their functions. Notably, transcription directions for inner and outer genes are depicted as clockwise and anticlockwise, respectively.

