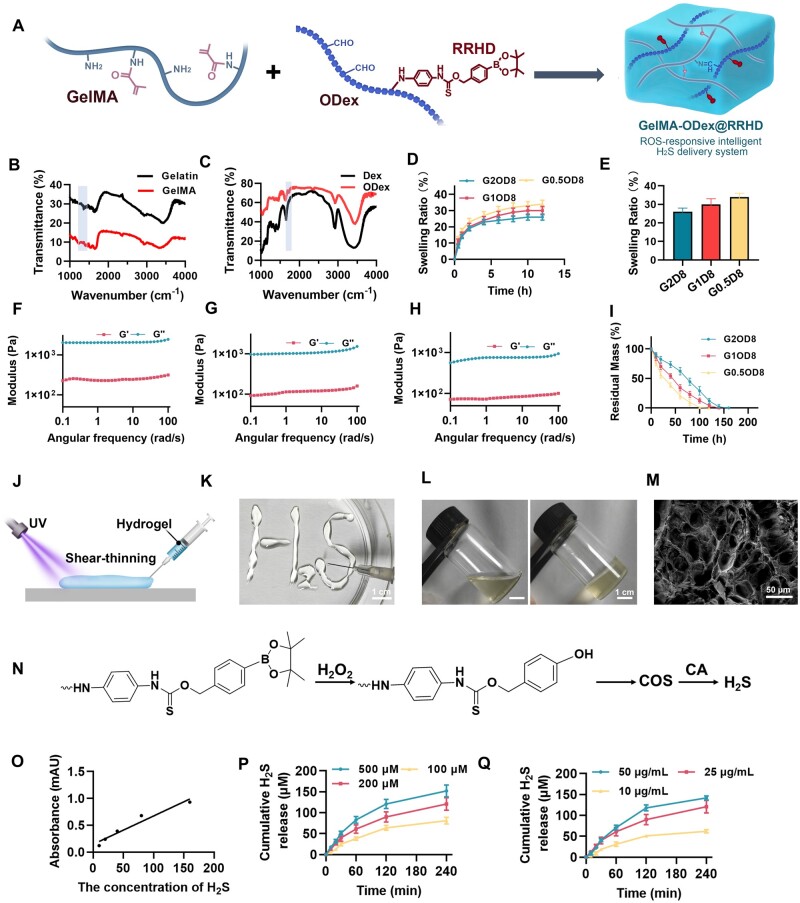
Figure 2.
Characterization of GelMA-ODex@RRHD. (A) Schematic illustration of the preparation of GelMA-ODex@RRHD hydrogel materials. (B) Fourier-transform infrared (FTIR) spectra of gelatin and GelMA. (C) FTIR spectra of dextran (DEX) and ODex. (D) Swelling data of three different ratios of GelMA and ODex hydrogels (G2OD8, G1OD8, G0.5OD8). (E) Statistical analysis of the swelling data shown in Figure D at 12h, comparing the swelling behavior of the three hydrogels. The storage modulus (G′) and loss modulus (G″) of G2OD8 (F), G1OD8 (G) and G0.5OD8 (H) hydrogel as a function of angular frequency. (I) Degradation profile of the G2OD8, G1OD8, G0.5OD8 with H2O2 (n = 5). (J) Illustration of the injectability of the hydrogel. (K) Pattern of H2S before light exposure, demonstrating the injectability of the hydrogel. (L) Changes in the gel before and after light exposure, with the left image showing the gel before light exposure and the right image showing the gel after solidification under light. (M) Scanning electron microscopy (SEM) image of GelMA-ODex@RRHD hydrogel. (N) Mechanism diagram of ROS-responsive H2S generation, illustrating the chemical reactions that release H2S in the presence of H2O2. (O) Standard curve of H2S release, showing the absorbance of different H2S concentrations. (P) H2S release profiles at different H2O2 concentrations (25 μg/ml CA, n = 5). (Q) H2S release profiles at different CA concentrations (200 μM H2O2, n = 5).

