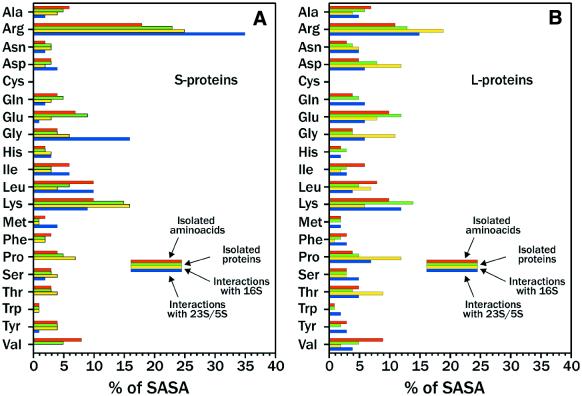
Figure 3.
Relative contribution of each amino acid of (A) S- and (B) L-proteins to: red bars, total SASA of the isolated amino acids of S- and L-proteins; green bars, total SASA of isolated S- and L-proteins; yellow bars, total SASA buried upon interaction of S- and L-proteins with 16S; blue bars, total SASA buried upon interaction of S- and L-proteins with 23S/5S.

