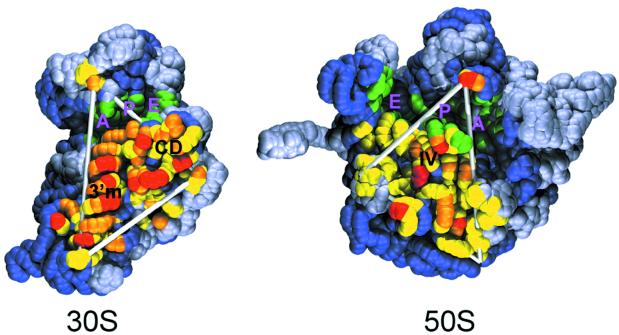
Figure 4.
Interface view of the 30S and 50S subunits from the 70S crystallographic structure (12). Yellow, orange and red spheres correspond to residues which, upon 30S and 50S association, bury <37.5 Å2, between 37.5 and 75 Å2, and >75 Å2 of SASA, respectively. Green spheres correspond to residues that interact with the A-, E- and P-tRNAs.

