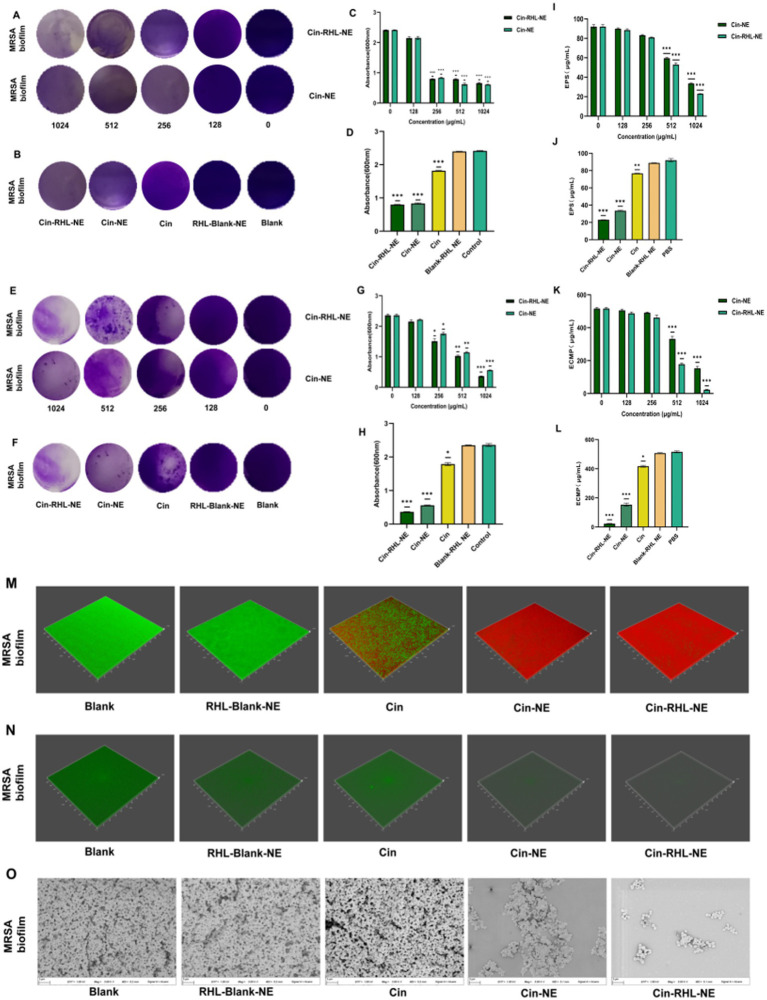
Figure 6.
In vitro assessment of MRSA biofilm eradication. (A) Crystal violet-stained images of MRSA biofilms after treatment with varying concentrations of Cin-RHL-NE and Cin-NE. (B) Crystal violet-stained images of MRSA biofilms post different treatments. (C) Biomass of MRSA biofilms following treatment with differing concentrations of Cin-RHL-NE and Cin-NE. (D) Biomass measurements of MRSA biofilms after various treatments. (E) Crystal violet-stained images showcasing the impact of Cin-RHL-NE and Cin-NE at varied concentrations on MRSA biofilms. (F) Eradication images of crystal violet-stained MRSA biofilms post different treatments. (G) Quantification of biomass from MRSA biofilms post-treatment with different concentrations of Cin-RHL-NE and Cin-NE. (H) Biomass assessment of MRSA biofilms after various therapeutic interventions. (I) Effects of different concentrations of Cin-RHL-NE and Cin-NE on the extracellular polysaccharide content of MRSA biofilms. (J) Analysis of the impact of various treatments on the extracellular polysaccharide content in MRSA biofilms. (K) Examination of the influence of variable concentrations of Cin-RHL-NE and Cin-NE on the extracellular protein content of MRSA biofilms. (L) Assessment of the effect of different treatments on the extracellular protein content in MRSA biofilms. (M) CLSM 3D reconstructions of MRSA biofilms post-treatment, where green fluorescence denotes live bacteria stained with SYTO 9 and red fluorescence represents dead bacteria stained with PI. (N) Detection of eDNA levels in MRSA biofilms using SYTOX staining. (O) Scanning Electron Microscopy (SEM) images of MRSA biofilms after various treatments, Scale bar, 3 μm. *p < 0.05, **p < 0.01, ***p < 0.001, using Student’s t-test.

