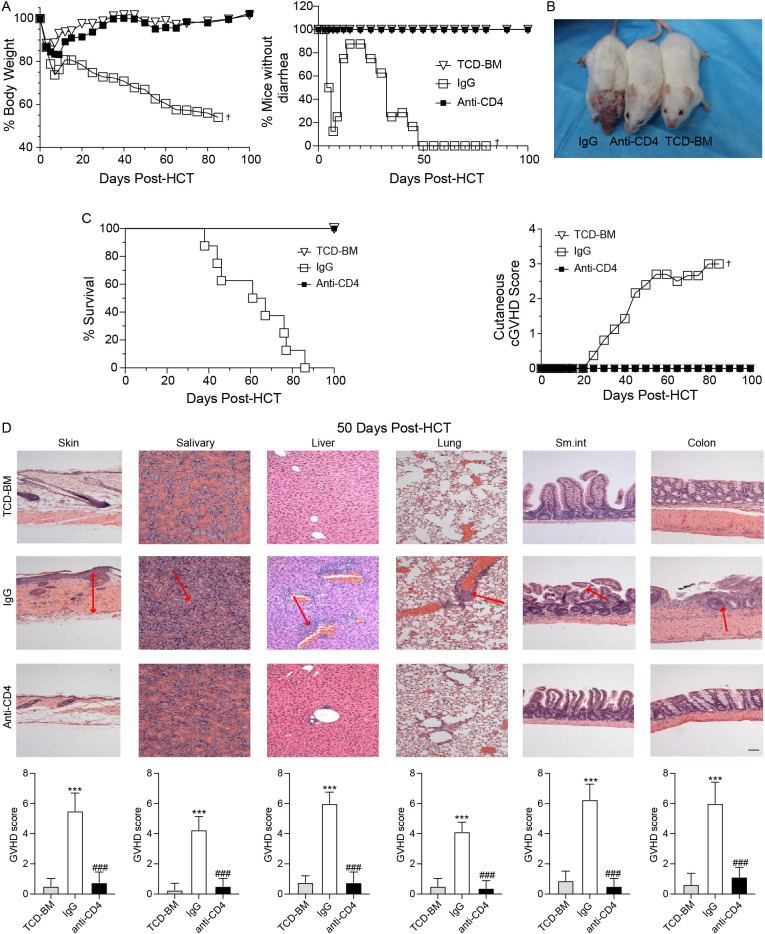
Figure 1.
Anti-CD4 antibodies prevent the development of cGVHD. (A) Graphs showing percentage of body weight changes (left) and absence of diarrhea (right) in TCD-BM mice (TCD-BM), IgG treated mice (IgG) and Anti-CD4 treated mice (Anti-CD4) after HCT. n=8 per group. (B) Representative images of mice (top) at 50-60 days post-HCT and the cutaneous cGVHD score (bottom) from TCD-BM, IgG and Anti-CD4 groups. n=8 per group. (C) Graphs showing the survival curves of TCD-BM, IgG and Anti-CD4 groups. n=8 per group. (D) Representative H&E -stained sections of skin, salivary, liver, lung, small intestine and colon (top) from TCD-BM, IgG and Anti-CD4 group, with corresponding GVHD scores (mean ± SEM) (bottom). n=8 per group. †indicates death of all recipients in a group. The red arrows indicate representative changes in GVHD targeted tissues. The statistical significance was performed according to one-way ANOVA followed by Tukey’s post hoc. ***p < 0.001 versus TCM-BM. ###p < 0.001 versus IgG. Scale bar: 100 μm.

