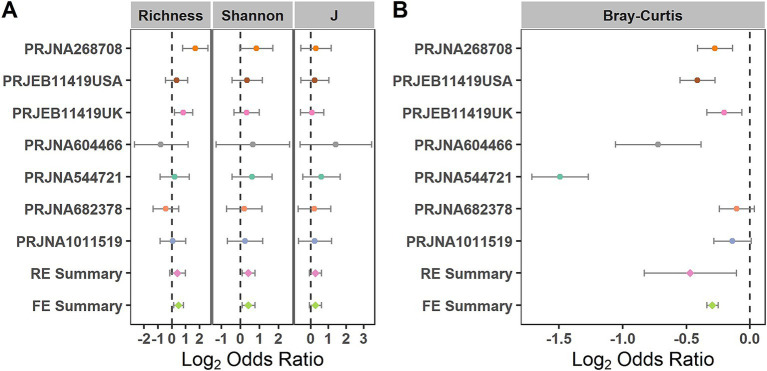
Figure 3.
Comparison of bacterial alpha diversity and beta diversity between the individuals with IBS and HS. (A) Forest plot of the alpha diversity metrics richness, Shannon Index, and evenness (J) between the individuals with IBS and HS; (B) Forest plot of the Bray–Curtis distance between the individuals with IBS and HS. The error bar depicts the 95% confidence interval. The ORs less than 1.0 (left side of the dashed line) indicate that the metric was higher in the patients with IBS than in the controls. The ORs greater than 1.0 (right side of the dashed lines) indicate that the metric was lower in the patients with IBS than in the controls. No intersection between the dashed line and the error bar indicates a significant difference between the patients with IBS and the controls.

