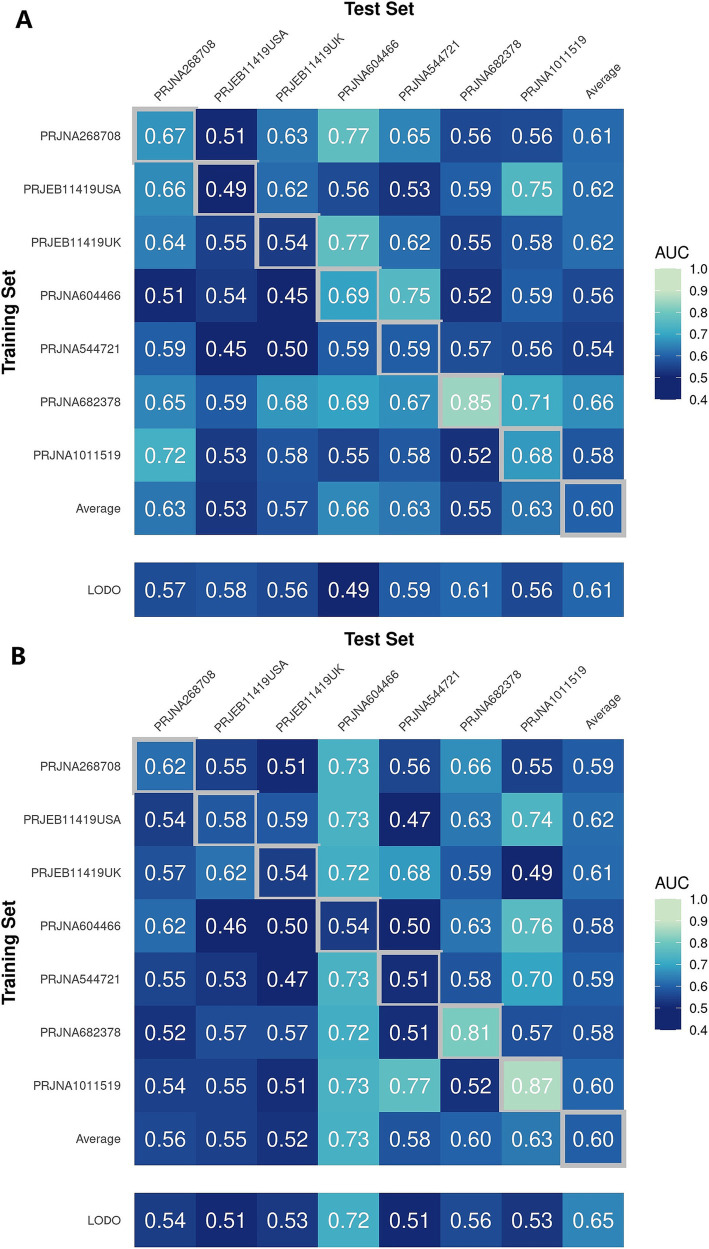
Figure 6.
Cross-prediction matrix reporting the prediction performances as the AUC values obtained using a random forest (RF) model on the (A) genus and (B) pathway level-relative abundances. The values boxed in yellow squares on the diagonal are the AUC values obtained by training and validating within the individual cohorts. The non-diagonal values refer to training a classifier on the dataset corresponding to the row and applying it to the dataset corresponding to the column to obtain the AUC values. The row averages are the average values excluding the diagonal values.

