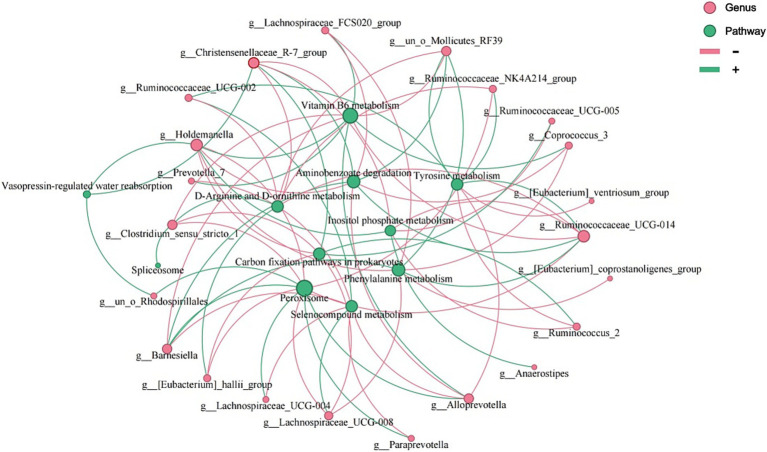
Figure 7.
Co-occurrence network plot showing the correlations between the 12 pathways and 26 genera that had significant Spearman correlation coefficients (i.e., with |correlation coefficient | > 0.5 and p < 0.05). The size of the nodes varies with the number of edges (red lines, negative correlations; green lines, positive correlations).

