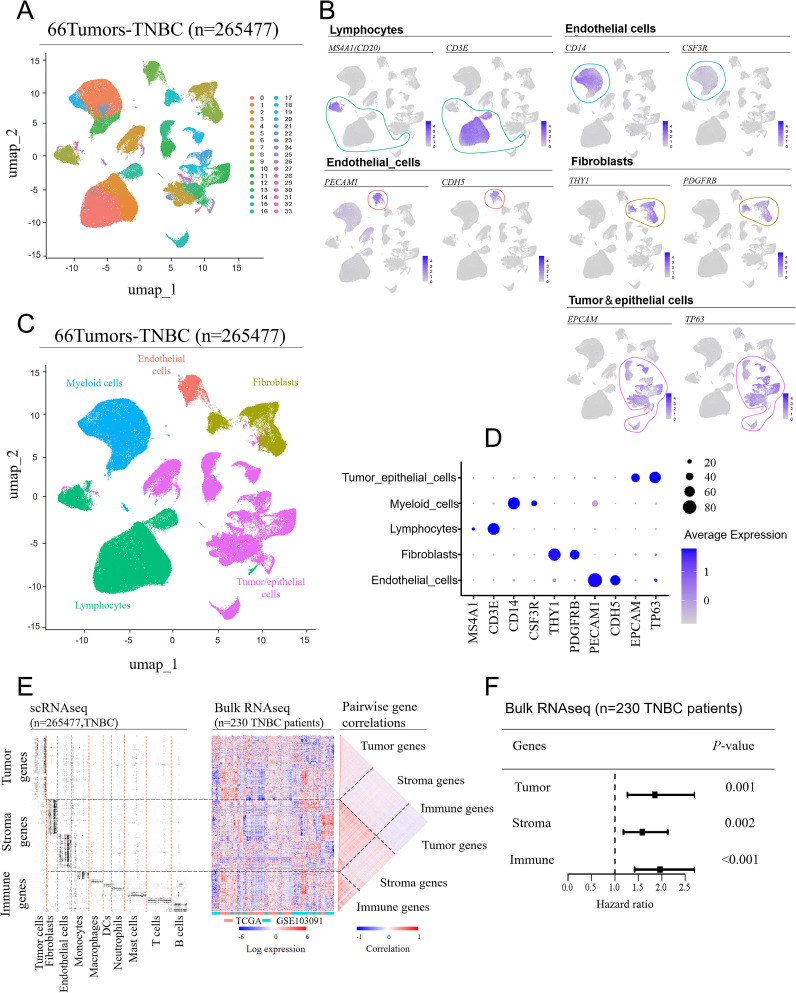
Figure 1.
Cell compartment of the tumor microenvironment in TNBC patients. Single-cell RNA sequencing (scRNA-seq) data from seven GEO datasets were integrated, covering 66 tissue samples (batch effects were removed using the “Seurat” package in R). (A) UMAP was used to separate the cell clusters. (B) Manual annotation was performed based on the expression characteristics of marker genes for the five cell cluster. (C) UMAP visualization of single-cell transcriptomes from 66 TNBC samples, showing the separation of major cell lineages. (D) A bubble plot displaying the expression levels of marker genes across different cell types. (E) Identification of dominant genes in each major cell type based on scRNA-seq data (fold-change > 3 compared to other cell types; adjusted P-value < 0.05) (left). These genes were mapped onto a bulk RNA-seq dataset from 230 TNBC patients (middle), showing their relative expression patterns, and pairwise correlations between the same genes (right). (F) Comparison of the prognostic impact of tumor-, stromal-, and immune-related genes. Hazard ratios for each feature were obtained using a multivariate Cox regression model (wald 95% confidence intervals and P-values are shown as horizontal bars), with cross-validated prognostic scores calculated using a GLMNET-based Cox model.

