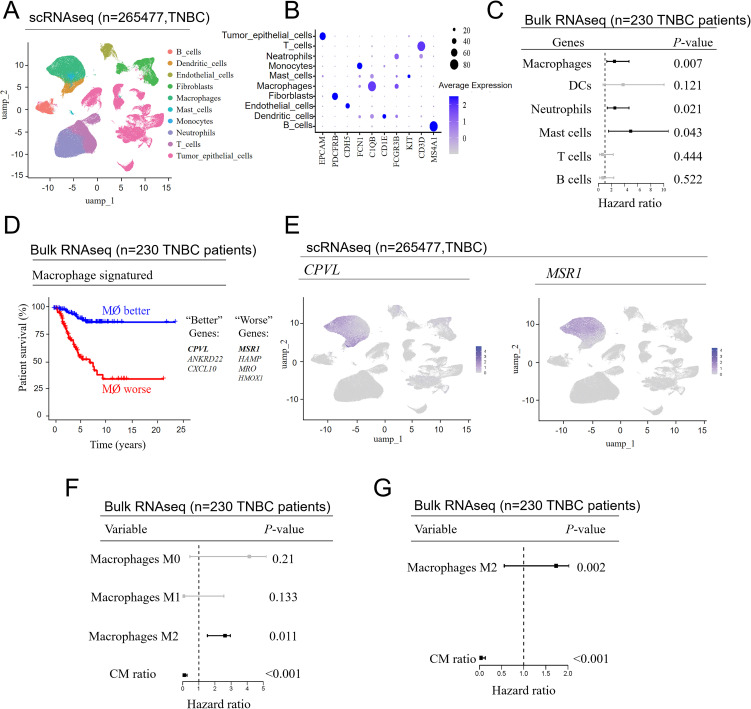
Figure 2.
CPVL and MSR1 in macrophages are genes significantly associated with the prognosis of TNBC patients. (A) UMAP plot of immune cells, showing further subclustering of the cell populations. (B) Bubble plot illustrating the expression patterns of marker genes in the different immune cell subpopulations. (C) Repeated analysis from the image (A), highlighting the impact of different immune cell subpopulations on prognosis. (D) Cross-validated macrophage prognostic scores from the image (C) were used to generate Kaplan-Meier curves, showing genes with opposite effects on prognosis at the 50% cutoff. (E) Display of the primary expression situation of CPVL and MSR1 in macrophages. (F) The degree of macrophage infiltration in patients’ tumors was first calculated using “CIBERSORT”, followed by the application of a univariate Cox model to assess the impact of macrophage infiltration and the CPVL/MSR1 ratio (CM ratio) on patient prognosis. (G) A multivariate Cox model was employed to assess the impact of M2 macrophage infiltration and CM ratio on patient prognosis.

