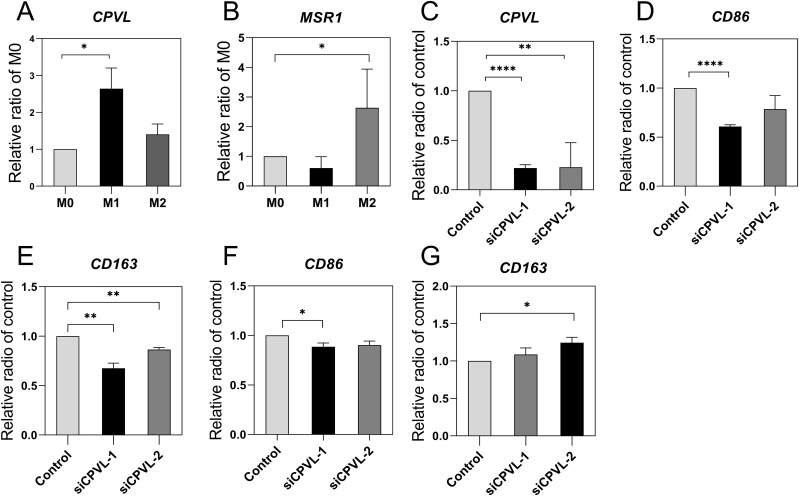
Figure 6.
Effect of CPVL and MRS1 on macrophage polarization. PCR was performed for the target genes and cell marker to observe mRNA levels in macrophages with different polarization states, and the values were subjected to T-tests for statistical significance. (All data were expressed as mean ± SEM; n = 3, and each set of experiments was repeated three times). (A, B) CPVL and MSR1 expression in different polarization states. (C-E) CPVL, CD86, CD163 expression in M0 macrophages, cells were treated with PMA then transfected with siRNAs targeting CPVL. (F, G) CD86, CD163 expression in M1-polarized macrophages. *Indicates that the P value is less than 0.05. **Indicates that the P value is less than 0.01. ***Indicates that the P value is less than 0.001.

