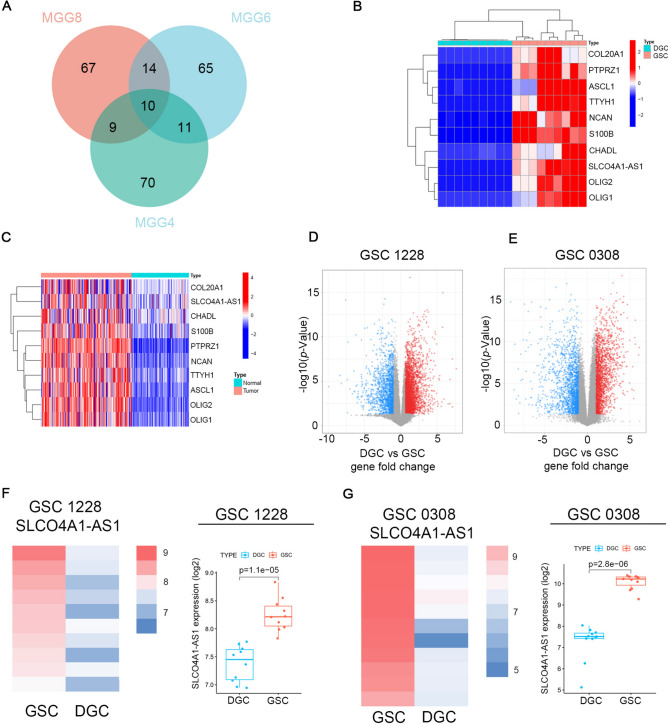
Fig. 1.
SLCO4A1-AS1 expression is upregulated in GBM. (A) The venn diagram shows the intersection of genes up-regulated in MGG4, MGG6 and MGG8 cultured under NBE conditions compared to culturing in serum conditions according to GSE54791 database. (B) Expression of identified genes in GSC and DGC according to GSE54791 database. (C) Expression of identified genes in GBM and normal brain tissue. (D, E) Volcano plot showing DEGs between GSCs and DGCs in 1228 cells (D) and 0308 cells (E) in the GSE4536 database. (F, G) The comparison of SLCO4A1-AS1 expression in GSC 1228 (F) and GSC 0308 (G) cultured under NBE and FBS conditions according to multiple probe sets of GSE4536 dataset. Significant statistical differences between the two groups were assessed using the Mann–Whitney test. NS, not statistically significant; * P < 0.05; ** P < 0.01; *** P < 0.001.

