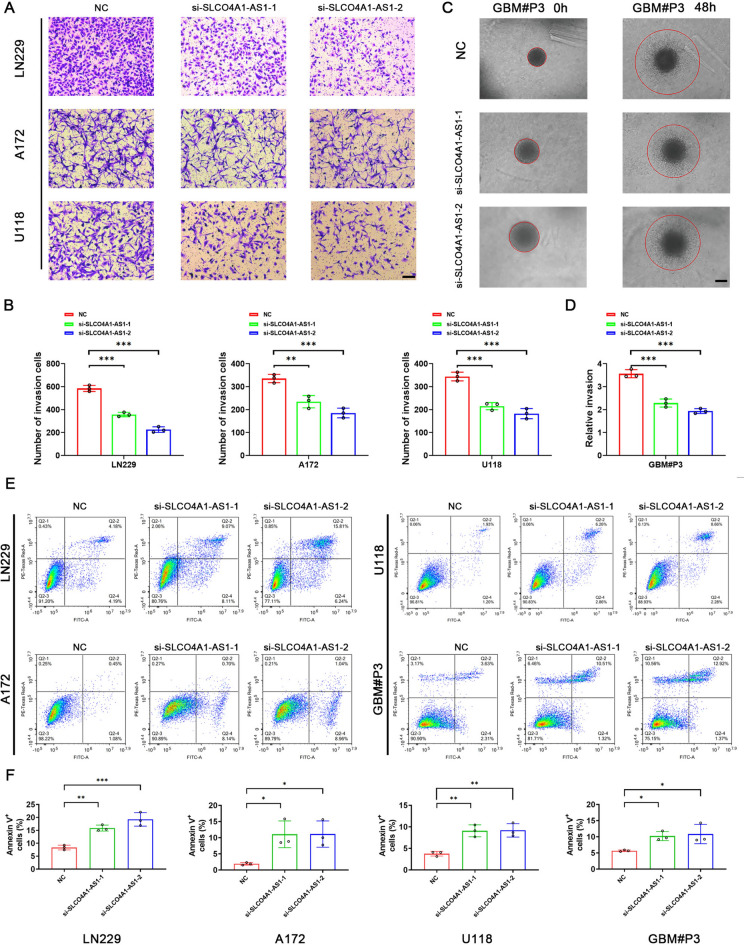
Fig. 5.
Invasion and apoptosis assay. (A) Transwell assay showing that knockdown of SLCO4A1-AS1 reduced the invasive ability of LN229, A172, and U118 cells (n = 3). Scale bar = 100 μm. (B) Quantitative analysis of the transwell assay results to assess the invasion ability of glioma cells following SLCO4A1-AS1 knockdown. (C) 3D tumor sphere invasion assay to assess the invasive capacity of GBM#P3 after knockdown of SLCO4A1-AS1 (n = 3). Scale bar = 100 μm. (D) Quantitative analysis of the 3D tumor sphere invasion assay results to assess the invasive ability of GBM#P3 following SLCO4A1-AS1 knockdown. (E) Annexin V staining of LN229, A172, U118, and GBM#P3 cells following SLCO4A1-AS1 knockdown (n = 3). (F) Quantitative analysis of Annexin V staining in LN229, A172, U118, and GBM#P3 cells following SLCO4A1-AS1 knockdown. Data are presented as the mean ± SD. NS, not statistically significant; * P < 0.05; ** P < 0.01; *** P < 0.001. 1-way ANOVA was used for data analysis.

