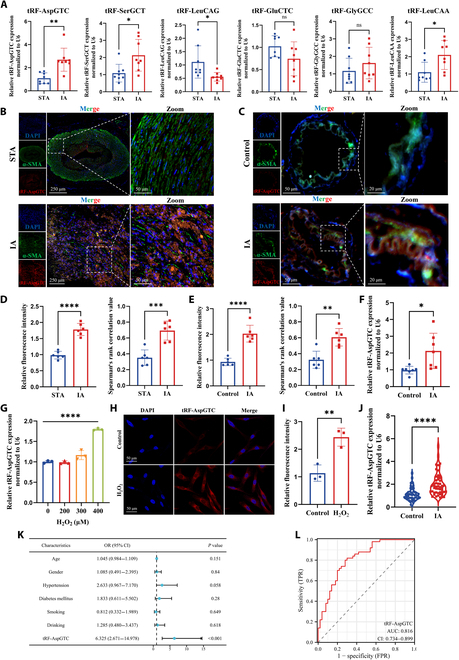
Fig. 1.

The transfer RNA-Asp-GTC derived fragment (tRF-AspGTC) is up-regulated in intracranial aneurysms (IAs). (A) Reverse transcription quantitative polymerase chain reaction (RT-qPCR) analysis of transfer RNA-derived small RNA (tsRNA) expression in human superficial temporal artery (STA) and IA tissues; n = 8 per group. (B) Fluorescence in situ hybridization (FISH) and immunofluorescence (IF) detection of tRF-AspGTC (red) and alpha smooth muscle actin (α-SMA) (green) colocalization, showing differential expression of tRF-AspGTC in human STA and IA tissues (scale bars = 250 and 50 μm). (C) FISH and IF detection of tRF-AspGTC (red) and α-SMA (green) colocalization, highlighting the expression differences of tRF-AspGTC in the brain arteries of normal and IA mice (scale bars = 50 and 20 μm). (D and E) Quantitative analysis of relative fluorescence intensity and Pearson correlation analysis of (B) and (C); n = 6 per group. (F) RT-qPCR analysis of tRF-AspGTC expression levels in the brain arteries of normal and IA mice; n = 7 per group. (G) RT-qPCR analysis of tRF-AspGTC expression levels in vascular smooth muscle cells (VSMCs) treated with varying concentrations of hydrogen peroxide; n = 3 per group. (H) FISH detection of tRF-AspGTC expression in VSMCs post 400 μM hydrogen peroxide treatment (scale bar = 50 μm). (I) Quantitative analysis of the relative fluorescence intensity of (H); n = 6 per group. (J) RT-qPCR analysis of tRF-AspGTC expression in plasma exosomes from healthy individuals and IA patients; n = 50 per group. (K) Multivariate logistic regression analysis of plasma exosomal tRF-AspGTC expression levels in IA patients. (L) Receiver operating characteristic (ROC) curve of plasma exosomal tRF-AspGTC expression in IA patients. *P < 0.05; **P < 0.01; ***P < 0.001; ****P < 0.0001. ns, not significant; DAPI, 4′,6-diamidino-2-phenylindole; OR, odds ratio; CI, confidence interval; TPR, true-positive rate; FPR, false-positive rate; AUC, area under the curve.
