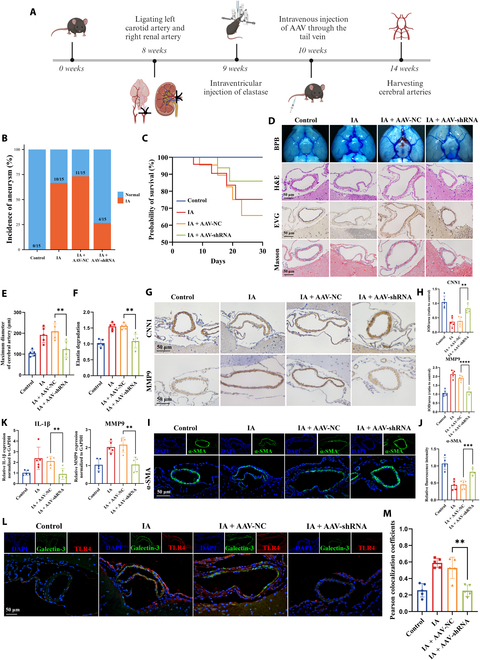
Fig. 8.

Knockdown of tRF-AspGTC inhibits IA formation and progression in vivo. (A) Schematic diagram of the animal model construction process. (B) Incidence of IAs in the indicated groups. (C) Survival curves of mice in the indicated groups. (D) Representative images of bromophenol blue perfusion staining, hematoxylin and eosin (H&E) staining, elastica–Van Gieson (EVG) staining, and Masson’s trichrome staining of the circle of Willis in mice. (E) Quantitative analysis of the maximum diameter of cerebral arteries in mice across the indicated groups; n = 5 per group. (F) Quantitative analysis of relative elastin degradation in the cerebral arteries of mice across the indicated groups; n = 5 per group. (G) IHC staining of CNN1 and MMP9 in the cerebral arteries of mice across the indicated groups. (H) Quantitative analysis of (G); n = 5 per group. (I) IF staining of α-SMA in cerebral arteries of mice across the indicated groups. (J) Quantitative analysis of (I); n = 5 per group. (K) RT-qPCR analysis of MMP9 and IL-1β mRNA expression levels in the cerebral arteries of mice across the indicated groups; n = 5 per group. (L) IF staining of galectin-3 and TLR4 in the cerebral arteries of mice across the indicated groups. (M) Pearson colocalization coefficient analysis of (L); n = 5 per group. **P < 0.01; ***P < 0.001; ****P < 0.0001. AAV, adeno-associated virus; shRNA, short hairpin RNA; BPB, bromophenol blue.
