
Figure 2.
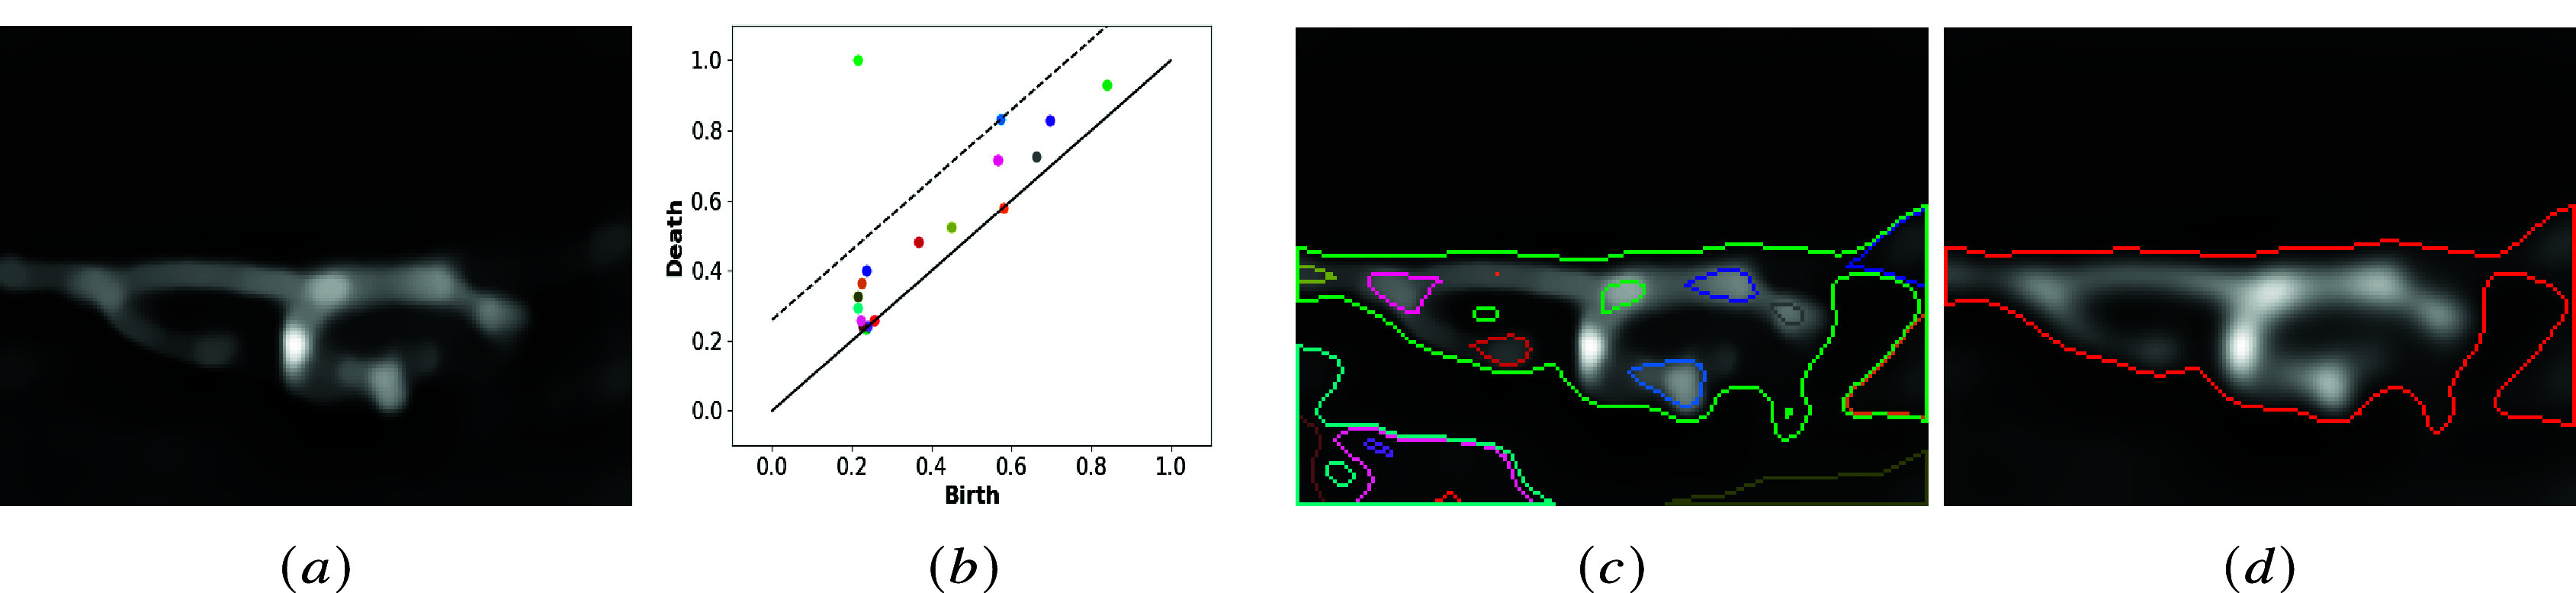
Segmentation of cell membranes: (a) the deconvolved original image; (b) persistence diagram and related optimum threshold (dashed line); (c) all the cycles displayed with the respective color used in (b); and (d) selected cycle with persistence larger than the optimum threshold.