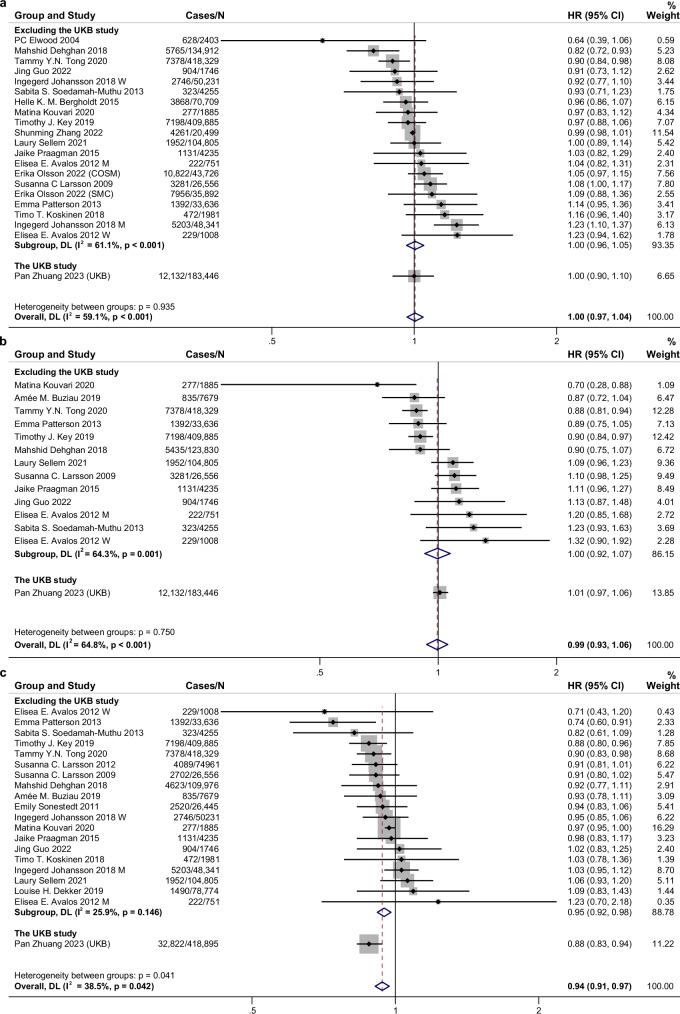
Fig. 2. Associations of milk, yogurt, cheese consumption with cardiovascular disease risk for high compared with low category of intake using random effects meta-analysis.
a Milk. b Yogurt. c Cheese. Meta-analysis pooling of aggregate data used the random-effects inverse-variance model with DerSimonian-Laird estimate of tau². Data are presented as hazard ratios (HRs) and 95% confidence intervals (CIs). Squares represent study-specific HRs. Horizontal lines denote 95% CIs. Gray square areas are proportional to the individual study weight for the overall meta-analysis. The red dotted line represents risk ratio of pooled meta-analysis. The blue hollow diamonds represent the results of the meta-analysis for each group, with the center indicating the risk ratio and the width representing the 95% CI. I2 refers to the proportion of heterogeneity among studies. All statistical tests were two-sided. M, men; W, women; CKB, China Kadoorie Biobank; UKB, UK Biobank. Source data are provided as a Source Data file.

