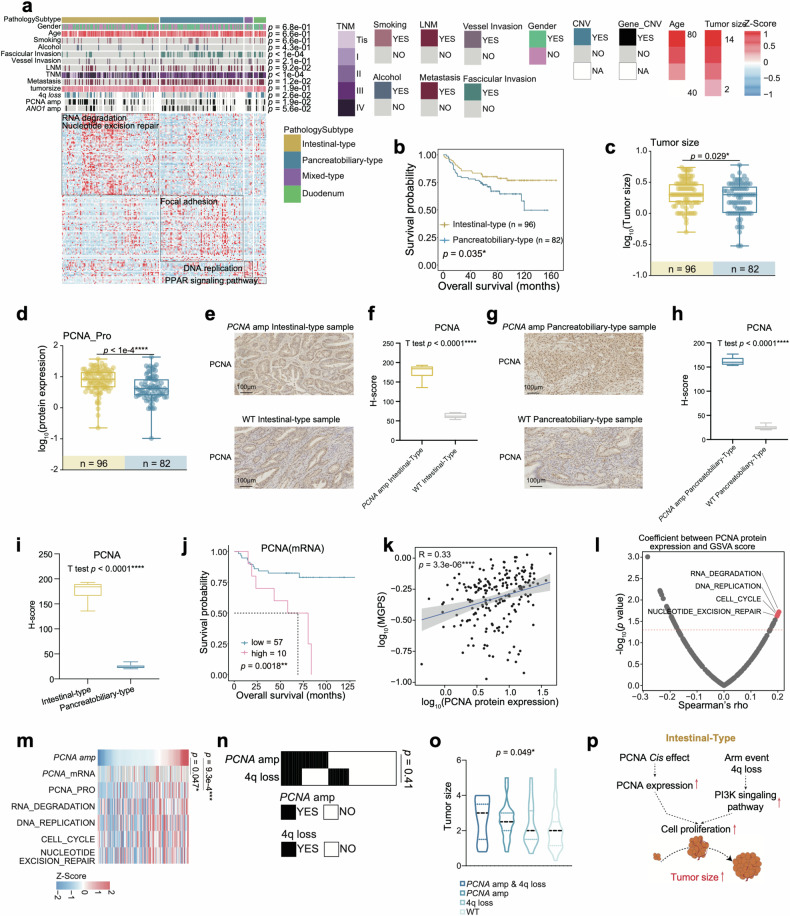
Fig. 4. Intestinal-type features with PCNA amp.
a Heatmap illustrated the characterization of four pathology subtypes. Each column represents a patient sample and rows indicate proteins. The color of each cell shows the z-score of the protein in that sample. AMPAC pathology classification, clinical features, and CNV status are shown above the heatmap. The χ2 test was used to evaluate the association of pathology subtypes with the variables on the heatmap, and p values were listed on the right. Single-sample Gene Set Enrichment Analysis (ssGSEA) based on proteomics data was also applied to identify the dominant pathway signatures in each pathology subtype. b The Kaplan–Meier curve for overall survival based on pathology subtype (log-rank test, p = 0.035). c PCNA amplification status in intestinal-type (left column, yellow) and pancreatobiliary-type (right column, blue) (Fisher’s exact test, p = 0.019). d Boxplot illustrated the tumor size among intestinal-type (yellow) and pancreatobiliary-type (blue) (Wilcoxon rank-sum test, p = 0.029). e IHC staining images exhibited the expression of PCNA between the intestinal-type samples with and without PCNA amp (Scale bars = 100 μm). f Boxplot exhibited the H-score of PCNA IHC images in the intestinal-type samples (Student’s t test, p < 0.0001). g IHC staining images exhibited the expression of PCNA between the pancreatobiliary-type samples with and without PCNA amp (Scale bars = 100 μm). h Boxplot exhibited the H-score of PCNA IHC images in the pancreatobiliary-type samples (Student’s t test, p < 0.0001). i Boxplot exhibited the H-score of PCNA IHC images in the intestinal-type and pancreatobiliary-type samples (Student’s t test, p < 0.0001). j The Kaplan–Meier curve for overall survival based on the PCNA mRNA expression (log-rank test p = 0.0018). k Spearman correlation of the abundance of PCNA and multi-gene proliferation scores (MGPS) (Spearman’s r = 0.33, p = 3.3e−6). l Spearman correlation of PCNA protein abundance and GSVA score (Spearman correlation). m Heatmap illustrated the PCNA amplification, the mRNA/protein abundance of PCNA, and GSVA scores. Spearman correlation tests were performed between PCNA amplification and the mRNA/protein abundance of PCNA, and p values were shown on the right. n The heatmap indicated the CNV status of PCNA amplification and 4q loss. Fisher’s exact test was used to evaluate the association between 4q loss and PCNA amplification, and the p value was on the right. o Violin plot indicated the comparisons of the four groups for the tumor sizes (Kruskal–Wallis test, p = 0.049). p Illustration of the regulatory role of PCNA amplification.

