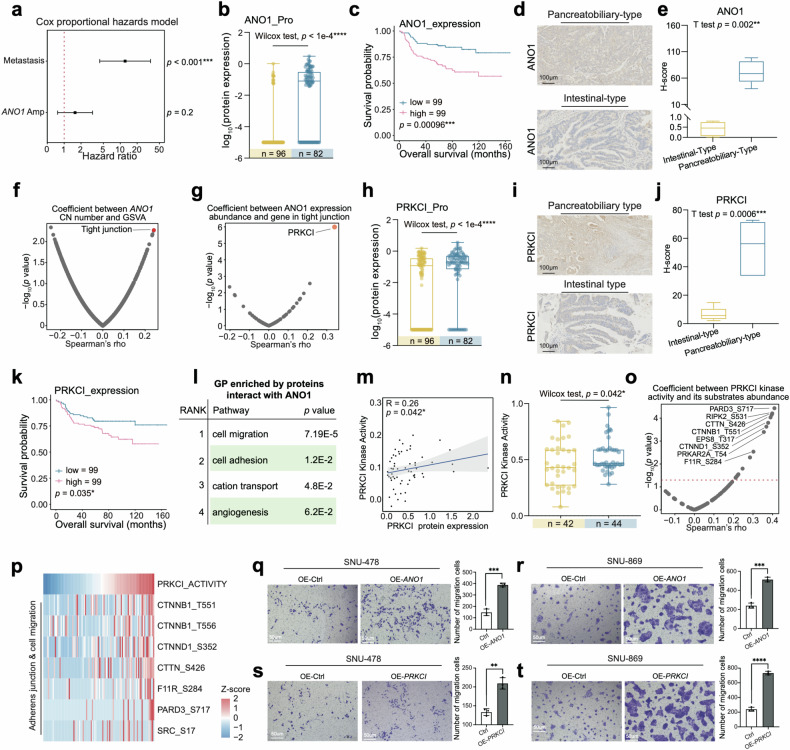
Fig. 5. Pancreatobiliary-type features with ANO1 amp.
a Metastasis status in intestinal-type (left column, yellow) and pancreatobiliary-type (right column, blue) (Fisher’s exact test, p = 0.0025). b The diagram illustrated the selection process of frequently occurred cis effect in the pancreatobiliary-type. c ANO1 amplification status in intestinal-type (left column, yellow) and pancreatobiliary-type (right column, blue) (Fisher’s exact test, p = 0.018). d The forest plot indicated the hazard ratios of metastasis status and ANO1 amplification. e Boxplot exhibited the H-score of ANO1 IHC images in the intestinal-type and pancreatobiliary-type samples (Student’s t-test, p < 0.0001). f Spearman correlation of ANO1 protein abundance and GSVA score (Spearman’s correlation). g Spearman correlation of ANO1 protein abundance and gene in tight junction pathway (Spearman’s correlation). h Boxplot illustrated PRKCI protein expression among intestinal-type (yellow) and pancreatobiliary-type (blue) (Wilcoxon rank-sum test, p < 1e−4). i IHC staining illustrated PRKCI was highly expressed in the pancreatobiliary-type sample compared to the intestinal-type sample (Scale bar = 100 μm). j Boxplot exhibited the H-score of PRKCI IHC images in the intestinal-type and pancreatobiliary-type samples (Student’s t-test, p < 0.0001). k The Kaplan–Meier curve for overall survival based on the ANO1 protein expression (log-rank test, p = 0.035). l GO pathways enriched by proteins interact with ANO1. m Spearman correlation of PRKCI protein abundance and PRKCI kinase activity (Spearman’s r = 0.26, p = 0.042). n Boxplot illustrated PRKCI kinase activity among intestinal-type (yellow) and pancreatobiliary-type (blue) (Wilcoxon rank-sum test, p = 0.042). o Spearman correlation of PRKCI kinase activity and the substrates of PRKCI (Spearman correlation). p Heatmap illustrated the PRKCI kinase activity and the abundance of substrates of PRKCI. q Transwell assay illustrated that OE-ANO1 groups in SUN-478 had enhanced migration ability compared with the control groups. The bar plots indicated the migrated cell counts of SNU-478 cells under different treatments (Student’s t-test). r Transwell assay illustrated that OE-ANO1 groups in SUN-869 had enhanced migration ability compared with the control groups. The bar plots indicated the migrated cell counts of SNU-478 cells under different treatments (Student’s t-test). s Transwell assay illustrated that OE-ANO1 groups in SUN-478 had enhanced migration ability compared with the control groups. The bar plots indicated the migrated cell counts of SNU-478 cells under different treatments (Student’s t-test). t Transwell assay illustrated that OE-ANO1 groups in SUN-869 had enhanced migration ability compared with the control groups. The bar plots indicated the migrated cell counts of SNU-478 cells under different treatments (Student’s t test).

