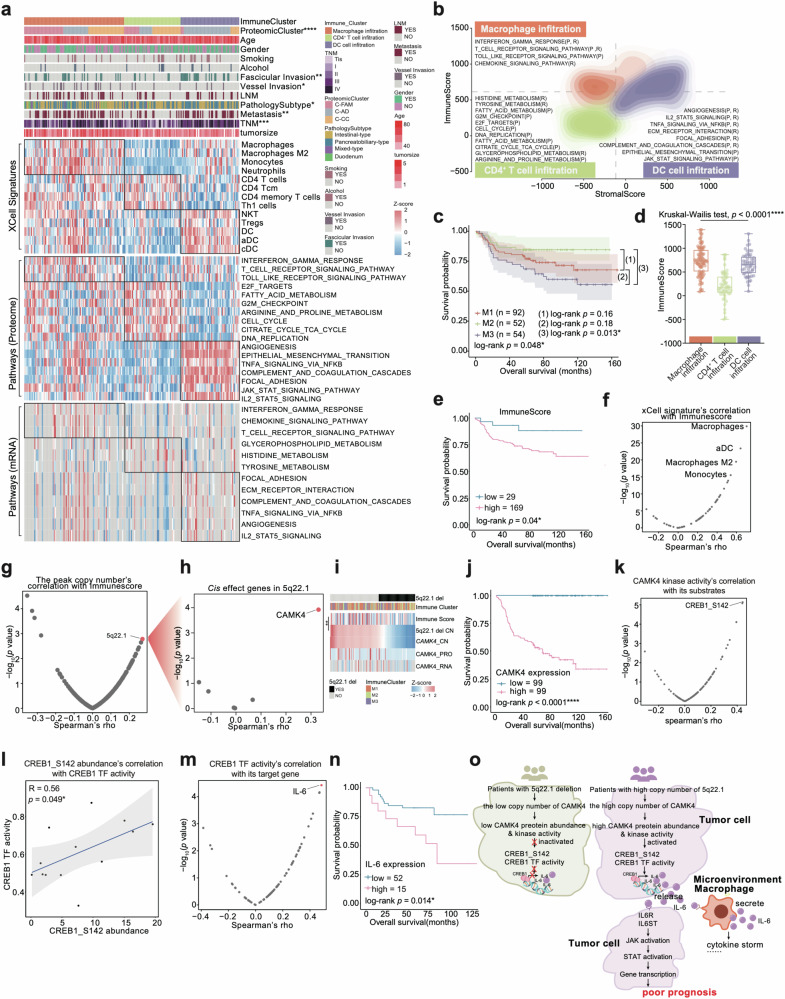
Fig. 7. Characterization of immune infiltration in AMPAC.
a Heatmap illustrated the characterization of three immune clusters. Each column represents a patient sample and rows indicate xCell signatures. The color of each cell shows the z-score of the xCell signature in that sample. AMPAC pathology classification, clinical features, and CNV status are shown above the heatmap. The χ2 test was used to evaluate the association of pathology subtypes with the variables on the heatmap, and p values (****p < 1.0e−4, ***p < 1.0e−3, **p < 1.0e−2, *p < 0.05, n.s. > 0.05) were listed on the right. Single-sample Gene Set Enrichment Analysis (ssGSEA) based on proteomic and transcriptomic data were also applied to identify the dominant pathway signatures in each immune cluster. b Contour plot of two-dimensional density based on immune scores (y-axis) and stromal scores (x-axis) for different immune clusters. For each immune cluster, key upregulated pathways and molecules were reported based on RNA-seq (R), and proteomics (P) in the annotation boxes. c Kaplan–Meier curves for overall survival based on immune clusters (log-rank test, p = 0.048 for the comparison of 3 immune clusters, p = 0.16 for the comparison of M1 and M2, p = 0.18 for the comparison of M2 and M3, p = 0.013 for the comparison of M2 and M3). d The boxplot indicated immune scores among the three immune clusters (Kruskal–Wallis test, p < 1e−4). e Kaplan–Meier curves for overall survival based on immune score (log-rank test, p = 0.04). f The scatter plot described the correlation between the immune score and the xCell signatures (Spearman correlation). g The scatter plot described the correlation between the immune score and all focal events copy number (Spearman correlation). h Volcano plot showing the cis effect genes on 5q22.1 (Spearman correlation). i The top panel was 5q22.1 deletion focal event distribution, and the medium panel was the immune cluster distribution; the bottom heatmap showed immune score, 5q22.1 copy number, CAMK4 copy number, CAMK4 protein expression abundance, and CAMK4 mRNA abundance. j Kaplan–Meier curves for overall survival based on CAMK4 protein expression (log-rank test, p < 1e−4). k The scatter plot described the correlation between the CAMK4 kinase activity and substrates of CAMK4 (Spearman correlation). l Spearman correlation of CREB1 TF activity and expression of CREB1/S142 (Spearman’s r = 0.56, p = 0.049). m The scatter plot described the correlation between the CAMK4 TF activity and target genes of CAMK4 (Spearman correlation). n Kaplan–Meier curves for overall survival based on IL-6 mRNA expression (log-rank test, p = 0.014). o The schematic diagram summarized that CAMK4 cis effect changed its downstream signaling, and led to alterations in the immune microenvironment, which were associated with a poorer prognosis for patients.

