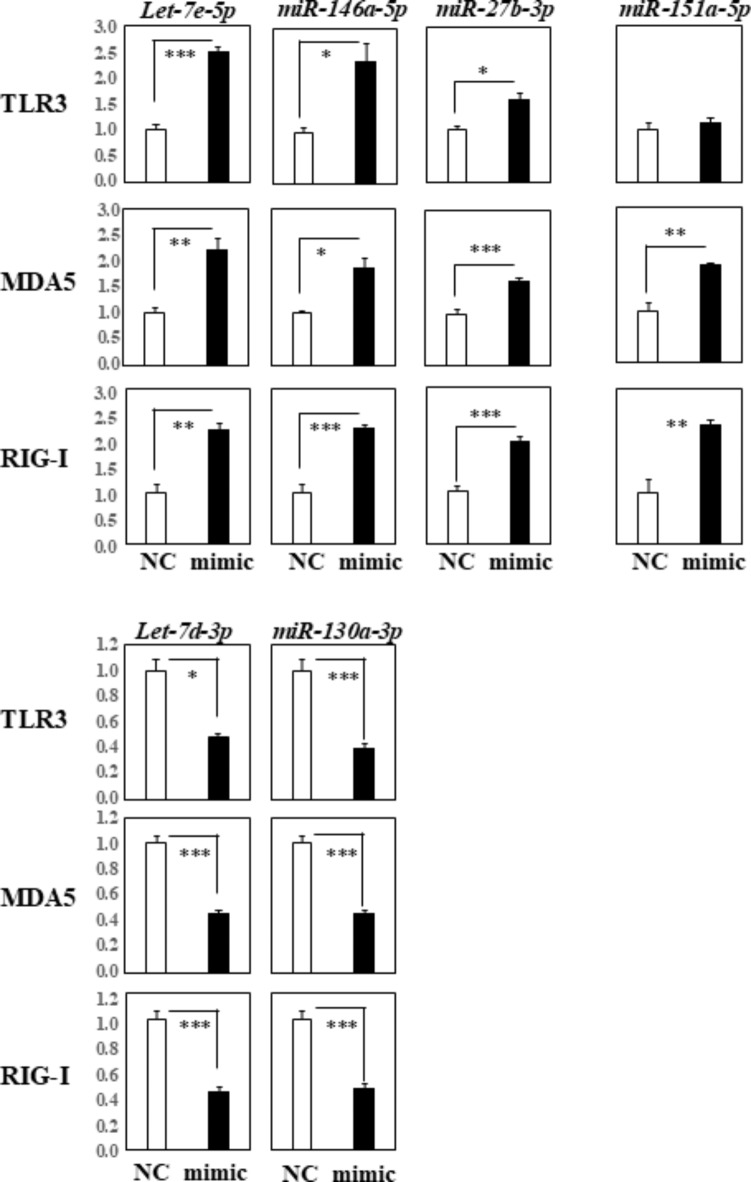
Fig. 2.
RT-qPCR Analysis of TLR3, MDA5, and RIG-I Gene Expression in THP-1 Cells Transfected with Specific miRNAs. This figure shows the results of our RT-qPCR analysis measuring the expression levels of TLR3, MDA5, and RIG-I genes in THP-1 cells following transfection with different miRNA mimics: let-7e-5p, miR-146a-5p, miR-27b-3p, miR-151a-5p, let-7d-3p, and miR-130a-3p. Quantification data were normalized to the expression of the housekeeping gene GAPDH. The Y-axis represents the fold increase in specific mRNA levels over the control samples (NC: non-targeting mimic control, mimic; each mimic of let-7e-5p, 146a-5p, 27b-3p, 151a-5p, let-7d-3p, 130a-3p miRNA). Data are presented as the mean ± standard error of the mean (SEM) from three independent experiments, with each group consisting of four replicates. Statistical significance is indicated by asterisks: *p < 0.05, **p < 0.005, ***p < 0.0005, highlighting differences in gene expression induced by each miRNA mimic compared to the control.

