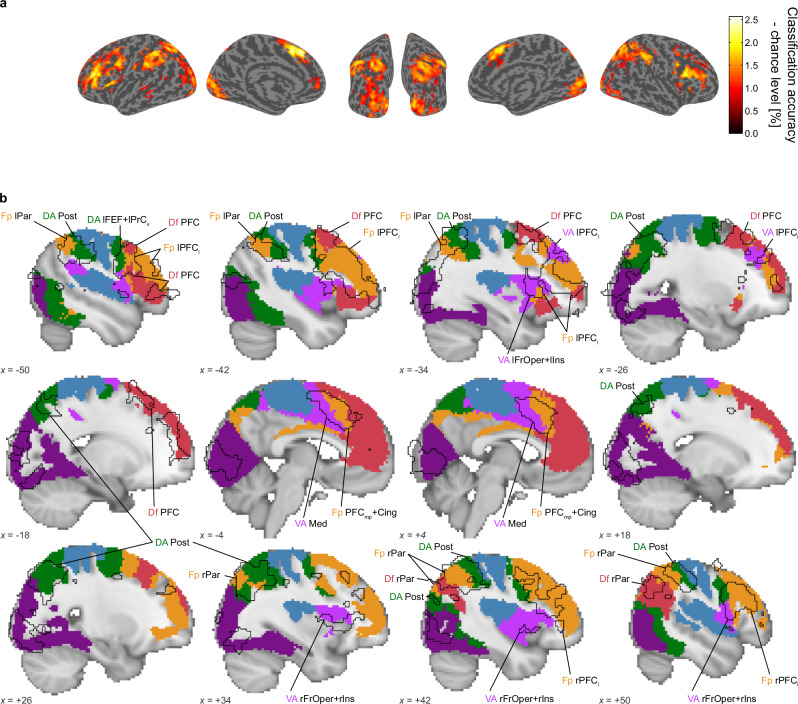
Fig. 4. Searchlight-based MVPA classification performance.
a Blobs represent brain regions where the searchlight-based MVPA identified performances above chance levels (one-sided t-test (n = 30), cluster-wise pFWE < 0.05 with voxel-wise threshold p < 0.001 (uncorrected) to define clusters). b Sagittal views of the statistically significant clusters (black solid outlines) identified in (a). The filled and colored areas indicate statistically significant ROIs in the ROI-based MVPA; the colors correspond to each functional network associated with these ROIs, as detailed in Supplementary Fig. 3. See the legend for Fig. 3 and Table 1 for a detailed description of ROI labeling. The MNI coordinates, located at the bottom left corner of each panel, indicate the specific location of each sagittal slice.

