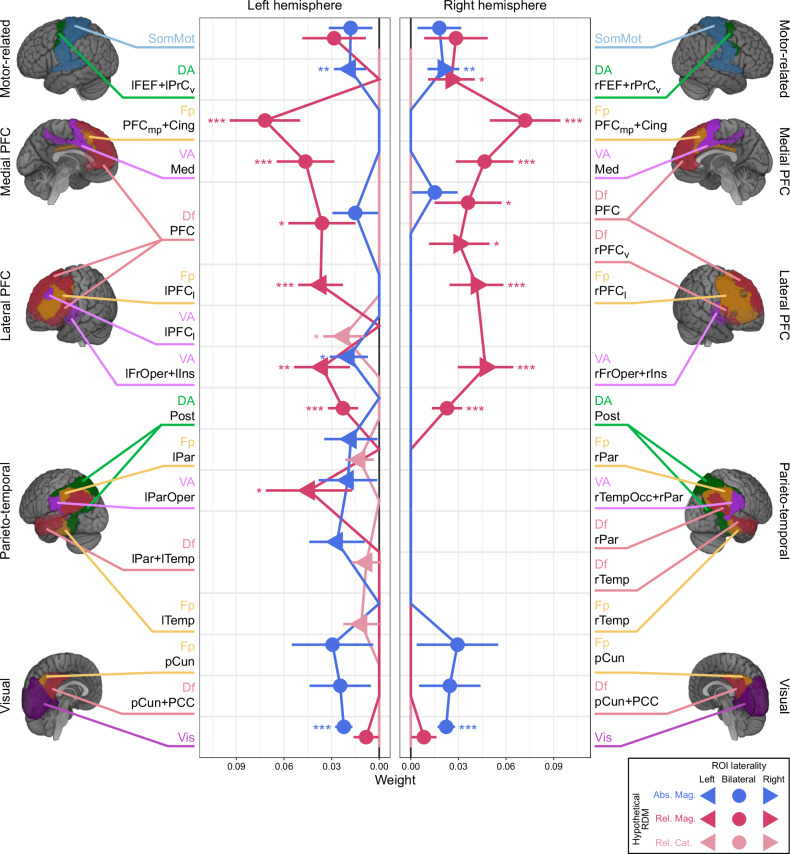
Fig. 6. Regression coefficients in ROI-based representational similarity analysis.
Displayed are the regression coefficients for fixed-effects (x-axis) across all ROIs (y-axis). The results for the left and right hemisphere ROIs, indicated by left- and right-headed triangles, are shown in the left and right panels, respectively. For the bilateral ROIs (circles), which span across both hemispheres, identical data are displayed in both panels to aid interpretation. The data points represent three different types of fixed effects: absolute magnitude-based (blue), relative magnitude-based (magenta), and relative category-based (light magenta) RDMs. The data points represent the regression coefficient, with error bars indicating the standard error of the coefficient, derived from the best model fitted to data RDMs from all participants (n = 30). In ROIs where a data point is absent, the corresponding fixed-effect was excluded in the selected model. *p < 0.05, **p < 0.01, ***p < 0.001 (one-sided t-tests against zero, Holm corrected for multiple comparisons). See the legend for Fig. 3 and Table 1 for a detailed description of ROI labeling. See Supplementary Table 2 for the statistical test results. Source data are provided as Source Data file.

