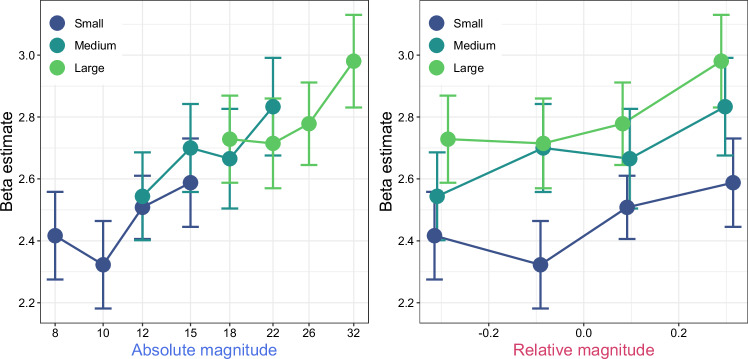
Fig. 7. Correlation between the average activity in the visual cortex and stimuli.
The figure presents scatter plots showing the correlation of the average activity in the visual cortex ROI (y-axis) with stimulus magnitudes (x-axis), categorized into either absolute magnitude (left panel) or relative magnitude (right panel). Each data point represents the average activity across participants, with error bars depicting the standard error of the mean (n = 30). The colors correspond to the numerosity set, as detailed in Fig. 1b. Source data are provided as Source Data file.

