
Table 1.
Kinetic parameters table used for metal ions adsorption onto modified ACF at a dosage of 0.5 g/L and pH 5.0 for Cu(II) and Cd(II) at 298 K.
| Metals |
 , exp (mg/g) , exp (mg/g) |
Pseudo-first order (PFO) (Qt) = Qe (1−eo−kt) |
Pseudo-second order (PSO)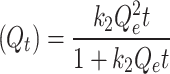
|
Weber-Morris (IPD)
|
||||||
|---|---|---|---|---|---|---|---|---|---|---|

(mg/g) |
k1 (/min) | R2 |

(mg/g) |
K2 (g/mg min) |
R2 |

(mg/g) |
C (mg/g) |
R2 | ||
| Cd(II) | 38.020 | 37.700 | 0.00592 | 0.9834 | 38.381 | 1.534E-4 | 0.9855 | 1.120 | 5.602 | 0.8268 |
| Cu(II) | 36.120 | 36.872 | 0.00371 | 0.9821 | 37.252 | 8.811E-5 | 0.9842 | 1.101 | 2.695 | 0.9282 |
In this context, Qe, exp and Qe, TH represent the experimentally and theoretically predicted equilibrium adsorption capacities of the metal ions (mg/g); k1 and k2 correspond to the PFO and PSO models, respectively, while R2 denotes the correlation coefficient.