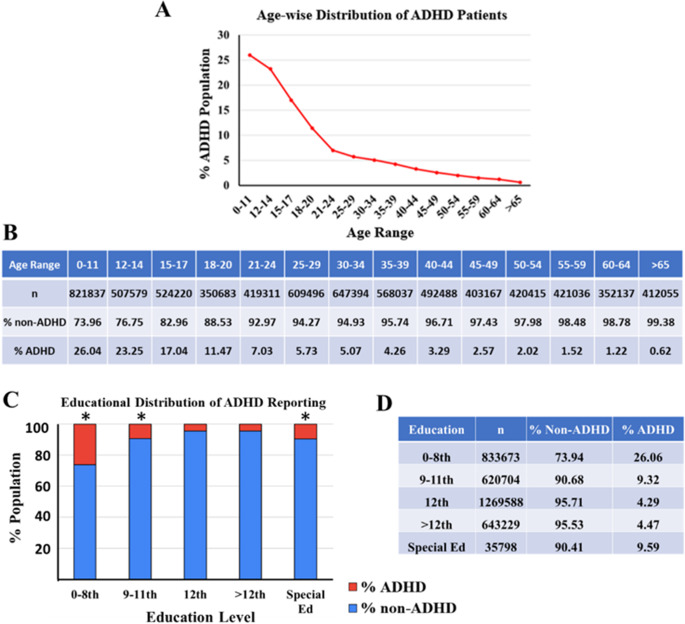
Figure 2.
The figure presents a comprehensive analysis of the distribution of ADHD patients based on age and education level. (a) The line graph represents the decreasing prevalence of reported ADHD (% population) with respect to the various age ranges (0–11, 12–14, 15–17, 18–20, 21–24, 25–29, 30–34, 35–39, 40–44, 45–49, 50–59, 60–64 and >65 years old) in a given population from data collected in the year 2022. (b) The table represents the ADHD and non-ADHD % populations with respect to age range, along with the total number of subjects (n) for each age range analyzed in this study. (c) The stacked bar chart represents the prevalence % of ADHD and non-ADHD reported population with respect to current grade level/highest education completed (special education, 0-8th, 9 to 11th, 12th and above 12th grade) in the year 2022. The ADHD population is represented in red, and the non- ADHD is represented in blue. *Indicates a statistically significant difference between age groups (ANOVA followed by pairwise comparison Bonferroni test, p < 0.0001). (d) The accompanying table provides numerical details, including the number of individuals (n) in each education category and the corresponding percentages of non-ADHD and ADHD individuals.

