
Figure 3.
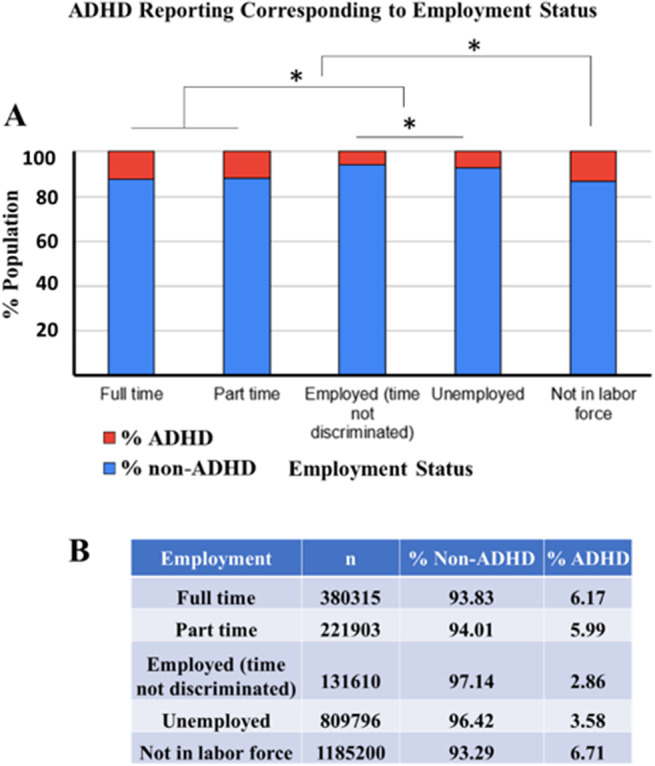
(a) The stacked bar chart represents the % ADHD and non-ADHD reported populations with respect to employment status (full-time, part-time, employed without discrimination of time, unemployed, and not in the labor force) in a given population from data collected in 2022. The ADHD population is represented in red, and the non-ADHD population is represented in blue. *Indicates a statistically true difference between groups (ANOVA followed by pairwise comparison Bonferroni test, p < 0.0001). (b) The table represents the ADHD and non-ADHD % populations with respect to employment status. n represents the total number of subjects in each category.