
Figure 7.
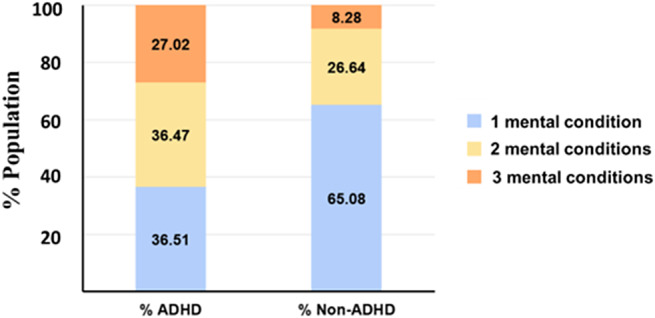
The figure presents a comparative analysis of the distribution of ADHD and non-ADHD individuals across three unspecified categories, represented by different colored segments (one mental condition – light blue, two mental conditions - yellow, three mental conditions – orange) within stacked bars.