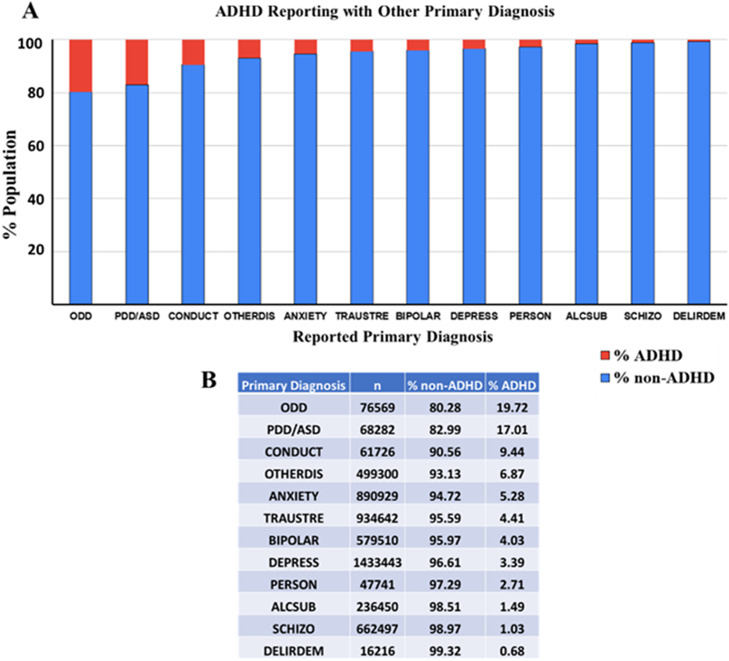
Figure 8.
The bar chart presents a detailed visual representation of the prevalence of ADHD as % population within various primary diagnoses such as ODD, pervasive developmental disorder/autism spectrum disorder (PDD/ASD), conduct disorder, other disorders, anxiety disorders, trauma/stress-related disorders, bipolar disorder, depression, personality disorders, alcohol/substance use disorders, schizophrenia, and delirium/dementia in a given population in the year 2022. The population diagnosed with ADHD is represented in red, and those without ADHD are represented in blue. *Indicates a significant contingency between the primary diagnosis and ADHD (chi-square contingency test, p < 0.0001). The table provides the number of individuals (n) within each primary diagnosis and the corresponding percentages of non-ADHD and ADHD patients.

