
Figure 9.
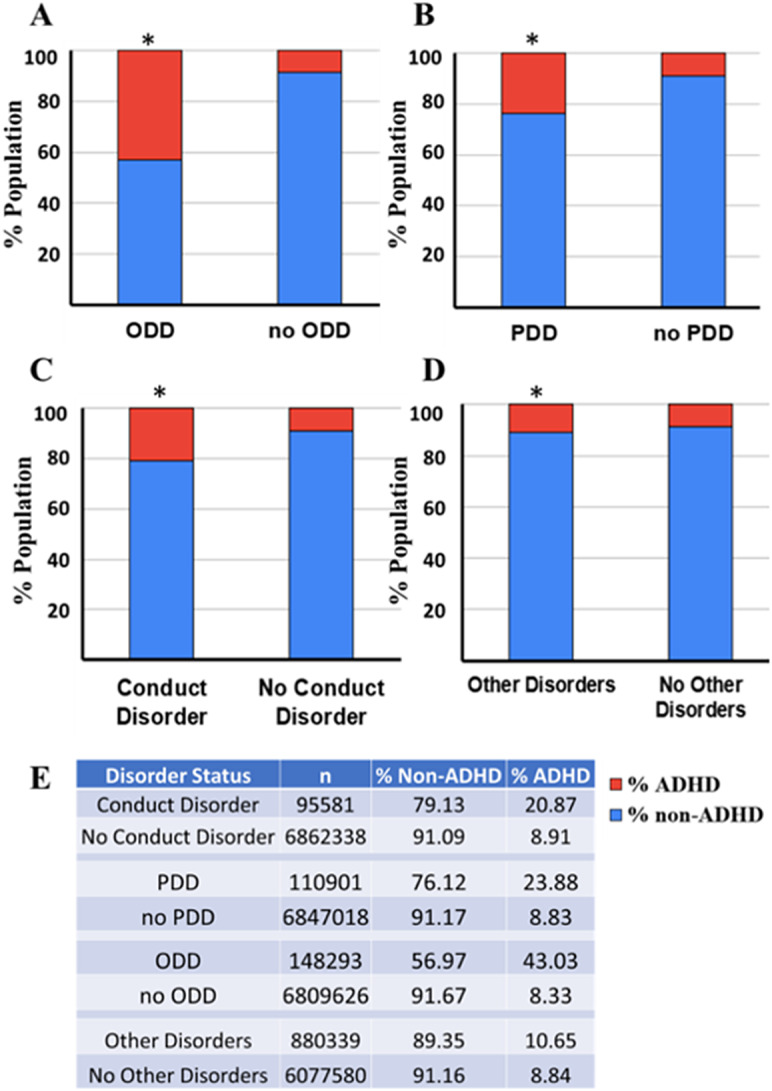
The figure effectively highlights the varying degrees of ADHD comorbidity across different primary diagnoses: ODD, PDD/ASD, conduct disorder, and other mental conditions. The population diagnosed with ADHD is represented in red, and those without ADHD are represented in blue. *Indicates a significant contingency between the primary diagnosis and ADHD (chi-square contingency test, p < 0.0001). The tables provide the number of individuals (n) within each diagnosis analyzed and the corresponding percentages of non-ADHD and ADHD patients.