Fig. 2.
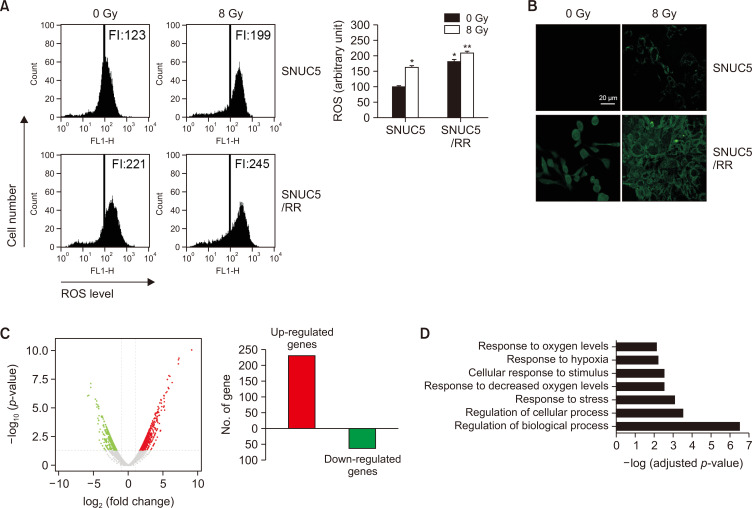
Intracellular ROS levels in SNUC5 and SNUC5/RR cells. (A, B) ROS levels detected using (A) flow cytometry and (B) confocal imaging after staining with H2DCFDA. FI indicates the fluorescence intensity of DCF. *p<0.05 vs. untreated SNUC5 cells; **p<0.05 vs. untreated SNUC5/RR cells (n=3). (C) Differentially expressed genes between SNUC5 and SNUC5/RR cells identified using RNA-Seq. Volcano plot presents differentially expressed genes between SNUC5 and SNUC5/RR cells. Red dots represent upregulated genes, and green dots represent downregulated genes. (D) Gene ontology enrichment analysis of the upregulated genes in SNUC5/RR and SNUC5 cells. The lengths of the bars indicate -log (adjusted p-value).

