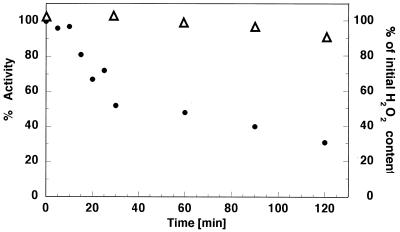
Figure 3.
Time course of pol γ catalytic subunit polymerase activity inhibition by 200 µM hydrogen peroxide. Exo–p140 was incubated either alone or with 200 µM H2O2 at 37°C. At the time intervals indicated samples were taken (0.2 pmol) and DNA polymerase activity (closed circles, left axis) on poly(dA)·oligo(dT) was measured as described in Materials and Methods. Percent activity at each time point was calculated relative to the control Exo–p140 samples collected at corresponding time points and used as the 100% reference. The rRight axis and open triangles depict the amount of H2O2 remaining after the incubation time relative to the zero time point.

