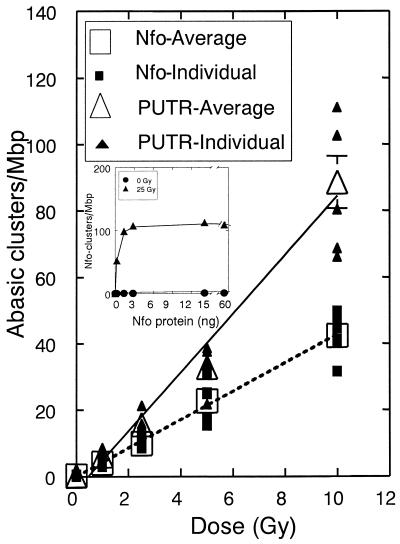
Figure 5.
Frequencies of abasic clusters detected by 1 mM PUTR and Nfo protein for T7 DNA irradiated with γ-rays in 20 mM phosphate buffer. Lines, least squares linear fit of the average points (large open symbols); error bars, standard errors of the means (for fitting parameters see Table 2). In some cases the errors are smaller than the symbols showing the average values. (Inset) Titration of irradiated (25 Gy) and unirradiated (0 Gy) T7 DNA with different amounts of Nfo protein.

