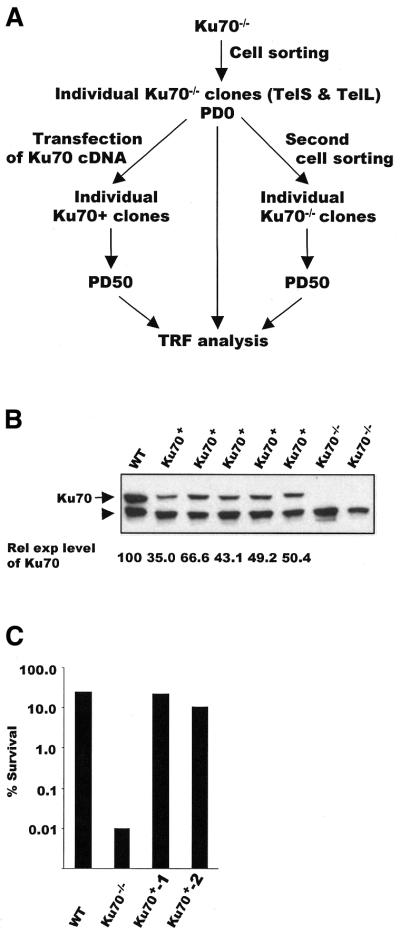
Figure 2.
Isolation of Ku70+ and Ku70–/– clones. (A) Scheme for isolating individual Ku70 clones. (B) Western blot showing expression of FcKu70 in Ku–/– cells transfected with FcKu70 cDNA. Lane 1, wild-type DT40; lanes 2–6, Ku+ TelL clones; lanes 7 and 8, Ku70–/– cells. The arrow marks the position of Ku70 and FcKu70; the arrowhead marks a cross-reacting band that was used to normalize for the amount of protein loaded in each lane. The level of FcKu70 expression relative to wild-type cKu70 expression is given below each lane. (C) Rescue of γ-radiation sensitivity by FcKu70 expression. Cells were treated with 2 Gy γ-radiation at the indicated times following release from nocodazole arrest. The fraction of colonies surviving compared with non-irradiated controls of the same genotype are shown for the 5 h time point. Ku70+-1 and Ku70+-2 represent two different Ku+ TelL clones.

