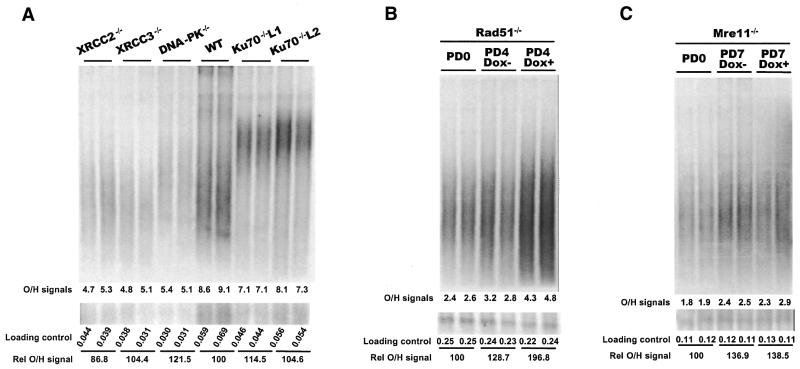
Figure 5.
Comparison of G-strand overhang length by in-gel hybridization. The upper panels show in-gel hybridization of 32P-labeled (C3AT2)4 probe to genomic DNA from DT40 cells deficient for various DSB repair proteins. The lower panels show loading controls. The bottom portion of each gel was removed before the in-gel hybridization, denatured, blotted to membrane and hybridized with a probe for total genomic DNA. (A) Ku70-, XRCC2-, XRCC3- and DNA-PKcs-deficient cell lines. As none of these cell lines contained a conditional allele, the hybridization signal for each mutant cell line was compared with the signal from wild-type samples run on the same gel (lanes 7 and 8). Lanes 9 and 10, and 11 and 12, contain samples from two different Ku70–/– clones with long telomeres. The total amount of G-overhang signal (×10–6) from the PhosphorImager analysis is given at the bottom of the upper panel while the total signal from the loading control is given at the bottom of the lower panel. The relative G-overhang signal for each lane is given as a percentage of the wild-type signal. (B) Rad51 conditional cells. Lanes 1 and 2, cells isolated at PD0; lanes 3 and 4, cells grown without doxycycline isolated at PD4; lanes 5 and 6, cells grown with doxycycline isolated at PD4. (C) Mre11 conditional cells. Lanes 1 and 2, cells isolated at PD0; lanes 3 and 4, cells grown without doxycycline isolated at PD7; lanes 5 and 6, cells grown with doxycycline isolated at PD7.

