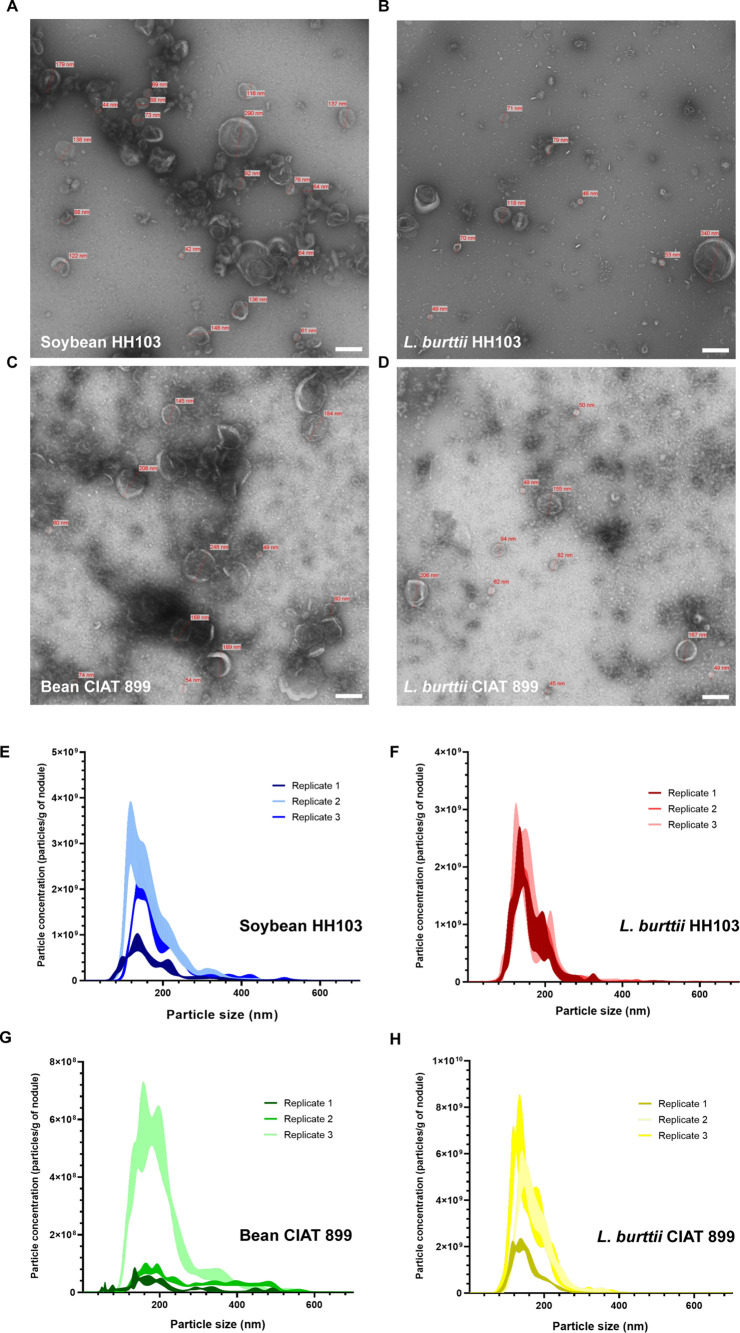
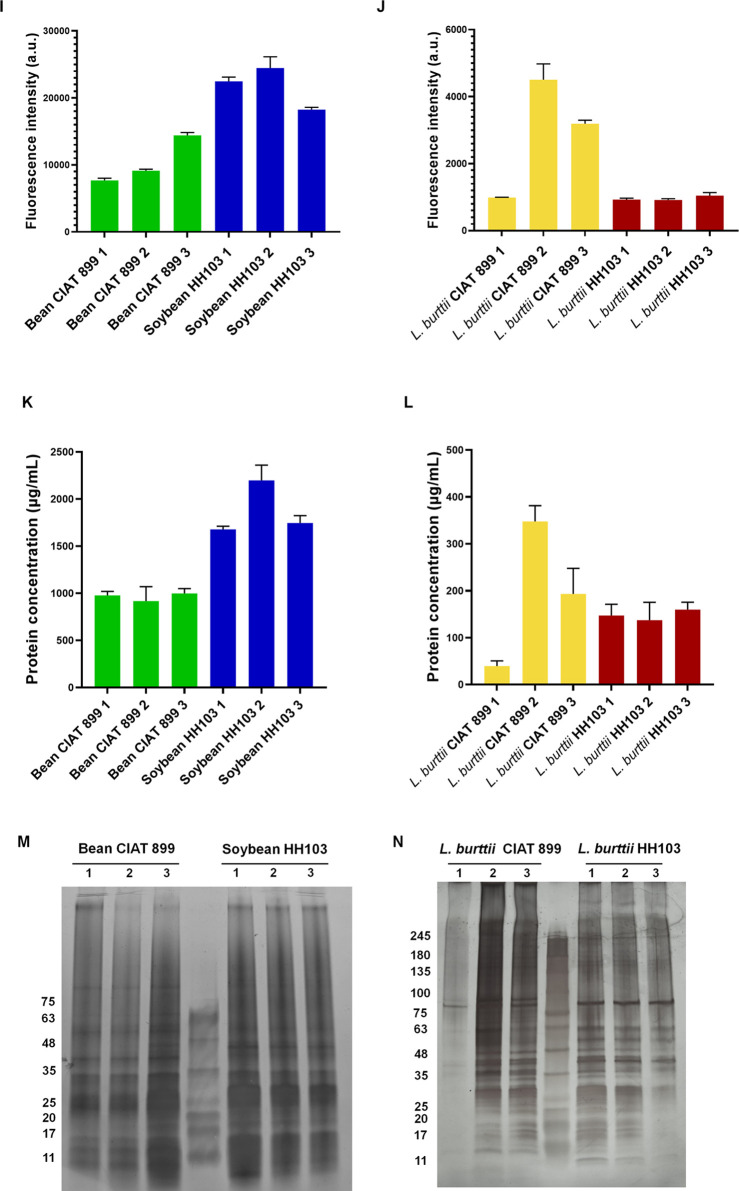
Figure 1.
Analysis of peribacteroid EVs isolated from nodules induced by S. fredii HH103 and R. tropici CIAT 899 in different legume plants. (A–D) Transmission electron microscopy images of negatively stained EVs from the symbiotic pairs HH103-soybean (A), HH103-L. burttii (B), CIAT 899-bean (C), and CIAT 899-L. burttii (D). Scale bar = 200 nm. (E–H) Nanoparticle tracking analysis by the NanoSight system of EVs from the symbiotic pairs HH103-soybean (E), HH103-L. burttii (F), CIAT 899-bean (G), and CIAT 899-L. burttii (H). Three replicates were performed for each set of samples. Fluorescence intensity (in arbitrary units, au) of EVs stained with FM1–43 from the symbiotic pairs are represented in graphs (bean-CIAT 899 and soybean-HH103 pairs (I) and L. burttii-CIAT 899 and L. burttii-HH103 pairs (J)). Protein quantification was analyzed by the BCA assay of bacteroid EVs from the different symbiotic pairs CIAT 899-bean and HH103-soybean (K) and CIAT 899-L. burttii and HH103-L. burttii (L). Protein profiles of bacteroid EVs from the different symbiotic pairs were analyzed by silver staining (M, N). The molecular weight marker (kDa) is indicated on the left. The sizes of the scale bars are indicated in the electron microscopy figures. Vesicle diameters are represented.


