
Fig. 2.
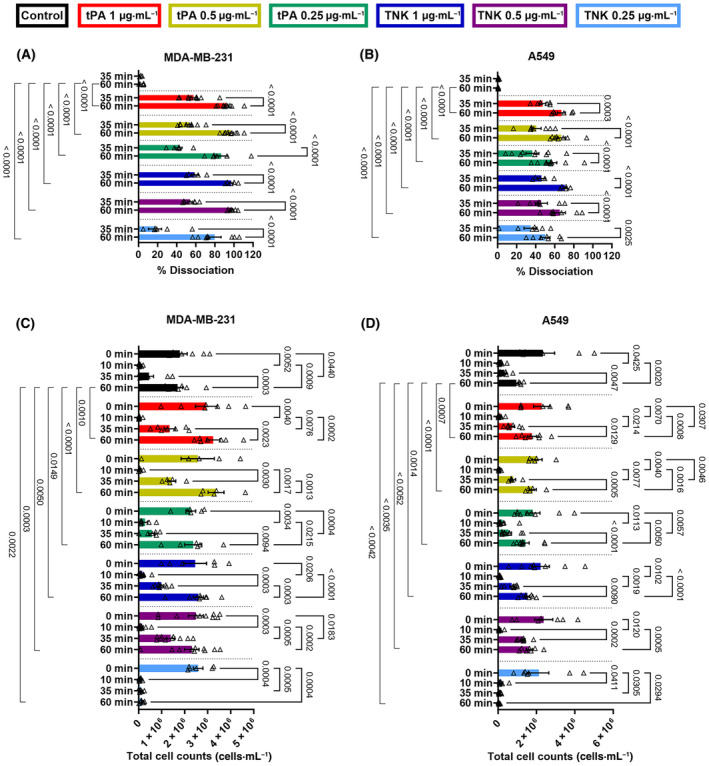
Validation of light transmission aggregometry (LTA) analysis via cell count measurement of MDA‐MD‐231 and A549 cancer cells. LTA analysis of the dissociation of (A) MDA‐MB‐231 and (B) A549 with various tissue plasminogen activator (tPA) and tenecteplase (TNK) conditions at 35 and 60 min. For validation, the number of (C) MDA‐MB‐231 and (D) A549 in the suspension were counted at 0 (when cancer cells were introduced), 10, 35, and 60 min. The tPA and TNK conditions were: control (MDA‐MB‐231: n = 6, A549: n = 7), 1 μg·mL−1 tPA (MDA‐MB‐231: n = 10, A549: n = 6), 0.5 μg·mL−1 tPA (MDA‐MB‐231: n = 9, A549: n = 8), 0.25 μg·mL−1 tPA (MDA‐MB‐231: n = 6, A549: n = 9), 1 μg·mL−1 TNK (MDA‐MB‐231: n = 5, A549: n = 5), 0.5 μg·mL−1 TNK (MDA‐MB‐231: n = 7, A549: n = 7), and 0.25 μg·mL−1 TNK (MDA‐MB‐231: n = 8, A549: n = 7). A two‐way ANOVA analysis with a Sidak's multiple comparison test was used to analyze the fibrinolytic dissociation of the tumor cell clusters and the supernatant cell counts over time within a treatment group, and a Tukey's multiple comparison test was used to compare the fibrinolytic dissociation of tumor cells and the supernatant cell counts between groups at the 60 min time point. For all conditions, the mean and standard error of the mean (SEM) are displayed.