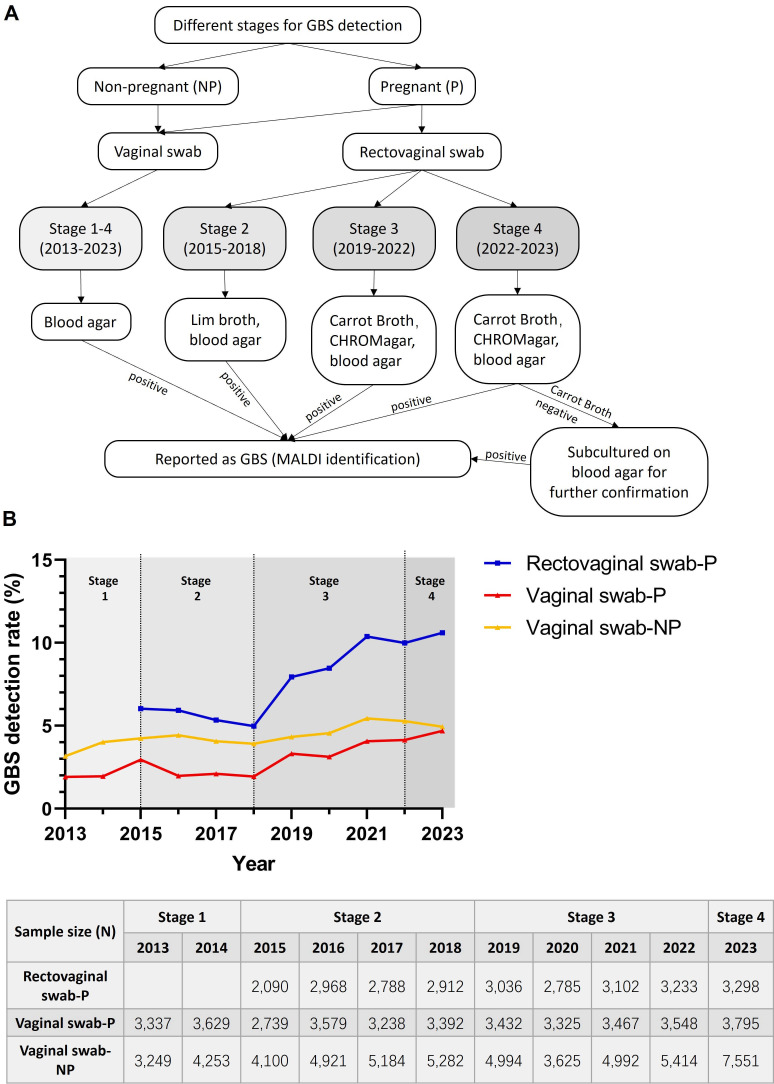
Fig 1.
(A) Evolution of the GBS detection method at PUMCH from 2013 to 2023. (B) Upper panel: the trends of the vaginal GBS detection rate from pregnant and non-pregnant women in the past decade. Lower panel: the sample size (N) of swabs submitted for each group per year. P indicates pregnant women. NP indicates non-pregnant women.

