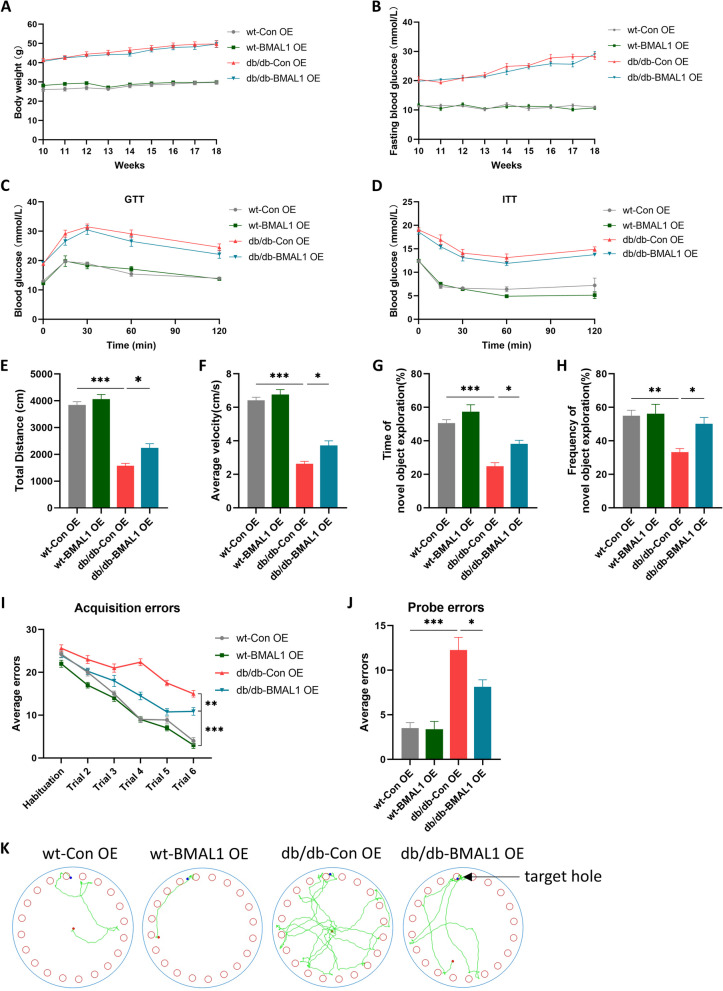
Fig. 2.
BMAL1 overexpression improved cognitive deficits. A Body weight (n = 8 per group). B Fasting blood glucose (n = 8 per group). C, D Blood glucose levels during GTT and ITT (n = 7 per group). E, F The total distance traveled and average velocity was assessed in the open field test (n = 8 per group). G, H The duration and frequency of exploring the novel object were assessed in the novel object recognition test (n = 8 per group). I, J Acquisition errors and probe errors of the Barnes maze test were assessed for spatial learning ability (n = 8 per group). Data were plotted as means ± SEM. *P < 0.05, **P < 0.01, ***P < 0.001. The data were analyzed by two-way ANOVA followed by post hoc Tukey’s HSD test

