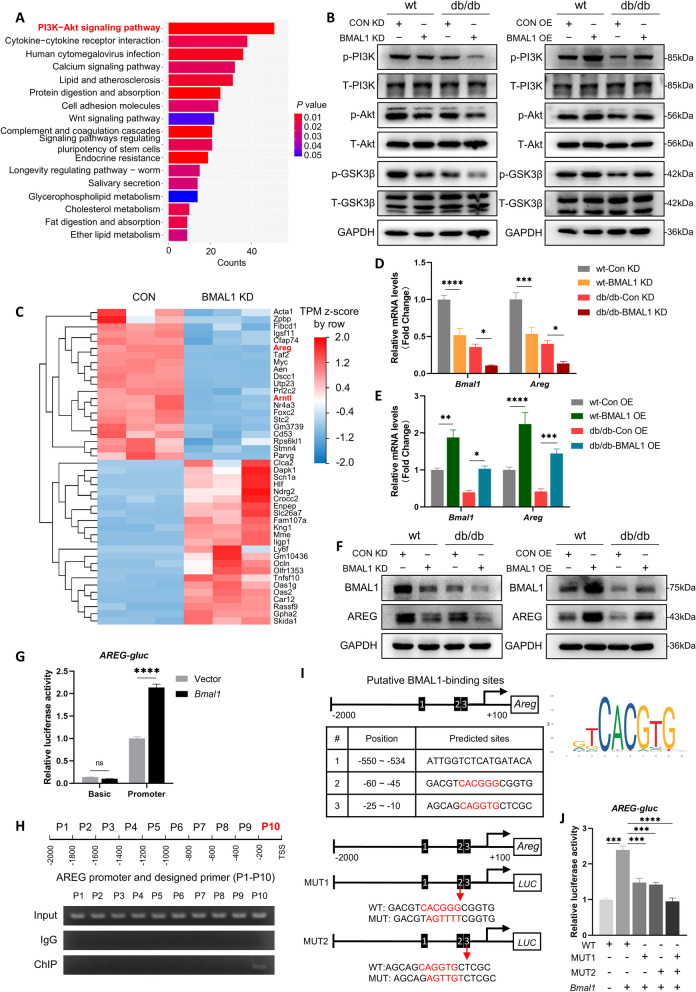
Fig. 5.
BMAL1 activated AREG/PI3K/Akt/GSK-3β signaling pathway in db/db mice. A KEGG enrichment analysis of those DEGs in sequence data of control and BMAL1-KD hippocampus. B Western blots of the phosphorylation level of PI3K, Akt, and GSK-3β in the hippocampus of mice in the BMAL1-KD and BMAL1-OE groups (n = 4 per group). C Heatmap showing the DEGs of control and BMAL1-KD hippocampus (D) Relative expression of Bmal1 and Areg mRNA in the hippocampus of mice in the BMAL1-KD four groups (n = 4 per group). E Relative expression level of Bmal1 and Areg mRNA in the hippocampus of mice in the BMAL1-OE four groups (n = 4 per group). F Western blots of protein level of BMAL1 and AREG in the hippocampus of mice in the BMAL1-KD and BMAL1-OE groups (n = 3 per group). G Dual-luciferase reporter analysis of Areg-promoter plasmid co-transfecting with vector or HA-Bmal1 (n = 3 per group). H ChIP and PCR analysis of the interaction between BMAL1 and Areg promotor. I Binding sites of BMAL1-Areg promoter predicted by JASPAR. J Dual-luciferase reporter analysis of HA-Bmal1 co-transfecting with WT Areg-promoter plasmid, or MUT1 (ATGGGG), or MUT2 (AGTTGT) (n = 3 per group). Data were plotted as means ± SEM. *P < 0.05, **P < 0.01, ***P < 0.001. The data were analyzed by two-way ANOVA followed by post hoc Tukey’s HSD test

