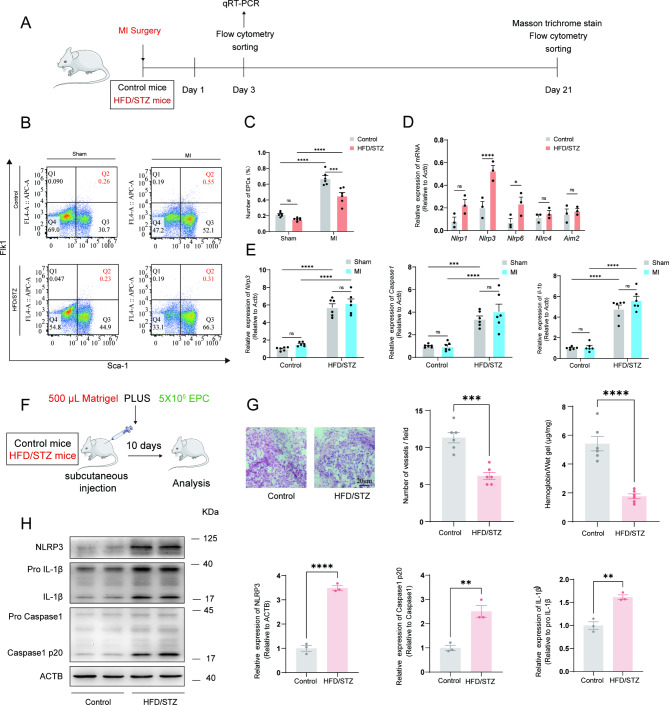
Fig. 2.
Reduced EPC mobilization and activated NLRP3 inflammasome in HFD/STZ-induced diabetic mice. (A) a diagram of the experimental protocol. (B) FACS analysis on peripheral blood mononuclear cells for EPC mobilization in groups. (C) The bar graph showed that EPC mobilization was impaired in HFD/STZ-induced diabetic mice as compared with control mice (n = 6 mice/group). (D) Nlrp1, Nlrp3, Nlrp6, Nlrc4 and Aim2 mRNA expression (RT-PCR) in flow cytometry-sorted EPC were quantified at 3 days after MI. (E) Nlrp3, Caspase1, and Il-1b mRNA expression (RT-PCR) in flow cytometry-sorted EPC were quantified at 3 days after MI. mRNA expression normalized to Actb and depicted as fold change versus control. (F) a diagram of the matrigel plug protocol. (G) Representative HE photographs of matrigel plugs removed from mice 10 days after injection (n = 6 mice/group). The relative amounts of hemoglobin extracted from the excised matrigel plugs and the number of blood vessels in matrigel plugs (n = 6 mice/group). (H) Relative NLRP3, Caspase1 p20, and IL-1β protein expression levels in EPC extracted from the excised matrigel plugs (n = 3 mice/group). * p < 0.05, ** p < 0.01, *** p < 0.001, **** p < 0.0001. These experiments were repeated independently at least three times with similar results

