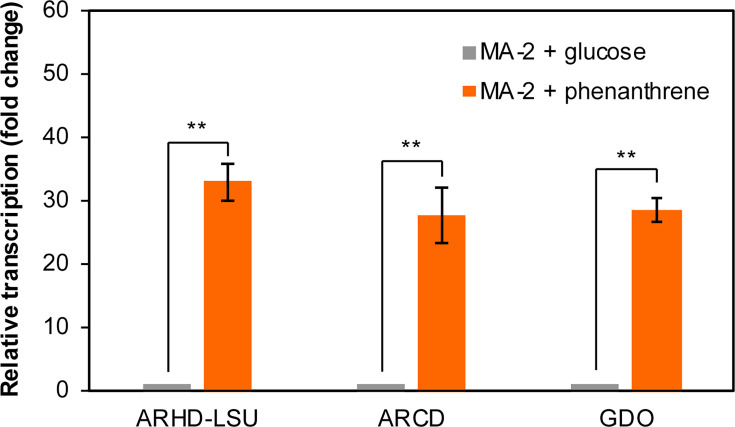
Fig 4.
Relative transcriptional levels of genes encoding ARHD-LSU, ARCD, or GDO in strain MA-2 cells cultivated with phenanthrene (orange bars) compared to the cells cultivated with glucose (gray bars). Relative transcriptional levels were determined using the 2-ΔΔCt method with the repC gene as the internal reference. **P < 0.01 (Welch’s t-test); error bars indicate standard deviations (n = 3).

