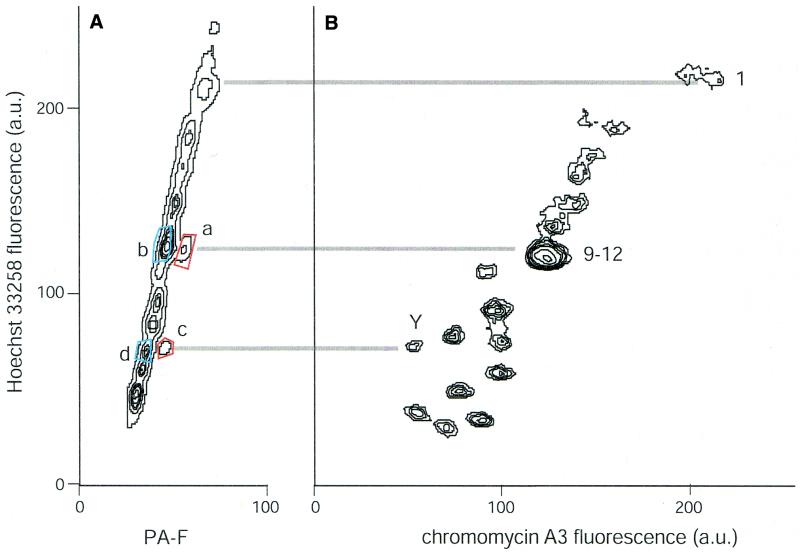
Figure 3.
Bivariate flow analyses of chromosomes treated with HO and the polyamide S-PA-F (A) or CA (B). Numbers represent the chromosome(s) responsible for the peaks in the flow karyotypes, with lines between the two plots drawn to indicate the positions of chromosomes 1, 9 and Y on the HO scales. Blue- and red-boxed areas in (A) denote sorting windows used to sort chromosomes analyzed further in Figures 4 and 5. Each plot represents measurements of ∼200 000 chromosomes.

